Near real-time performance data collection in OMS
Summary: Learn about setting up and using near real-time performance data in Microsoft Operations Management Suite.
Good morning everyone. Ed Wilson here, and today I want to talk about near real-time performance data collection in OMS. One of things I have always loved about Windows is the way that I can collect performance data. By diving into performance data, I can often pinpoint problem areas or areas that are soon to become problem areas. In fact, my friend, Clint Huffman, wrote the Performance Analysis of Logs (PAL) tool that many IT pros use to glean diagnostic insights.
Note This is a five-part series that includes the following posts:
- Near real-time performance data collection in OMS
Learn about setting up and using near real-time performance data. - Add counters to near real-time data collection in OMS
Learn how to add various counters to near real-time performance data. - Use OMS Search to visualize collected performance data
Drill in to a graph that shows metrics about your computer. - Filter OMS near real-time performance counter data by computer
Use Log Search to filter near real-time performance counter data by computer name. - Use OMS near real-time performance counters to check one counter
Check the status of a single counter across all your systems.
With the near real-time collection of performance-counter data, I can gain insights into performance issues with a sample interval of down to 10 seconds. In addition, I can easily visualize the resulting data inside OMS.
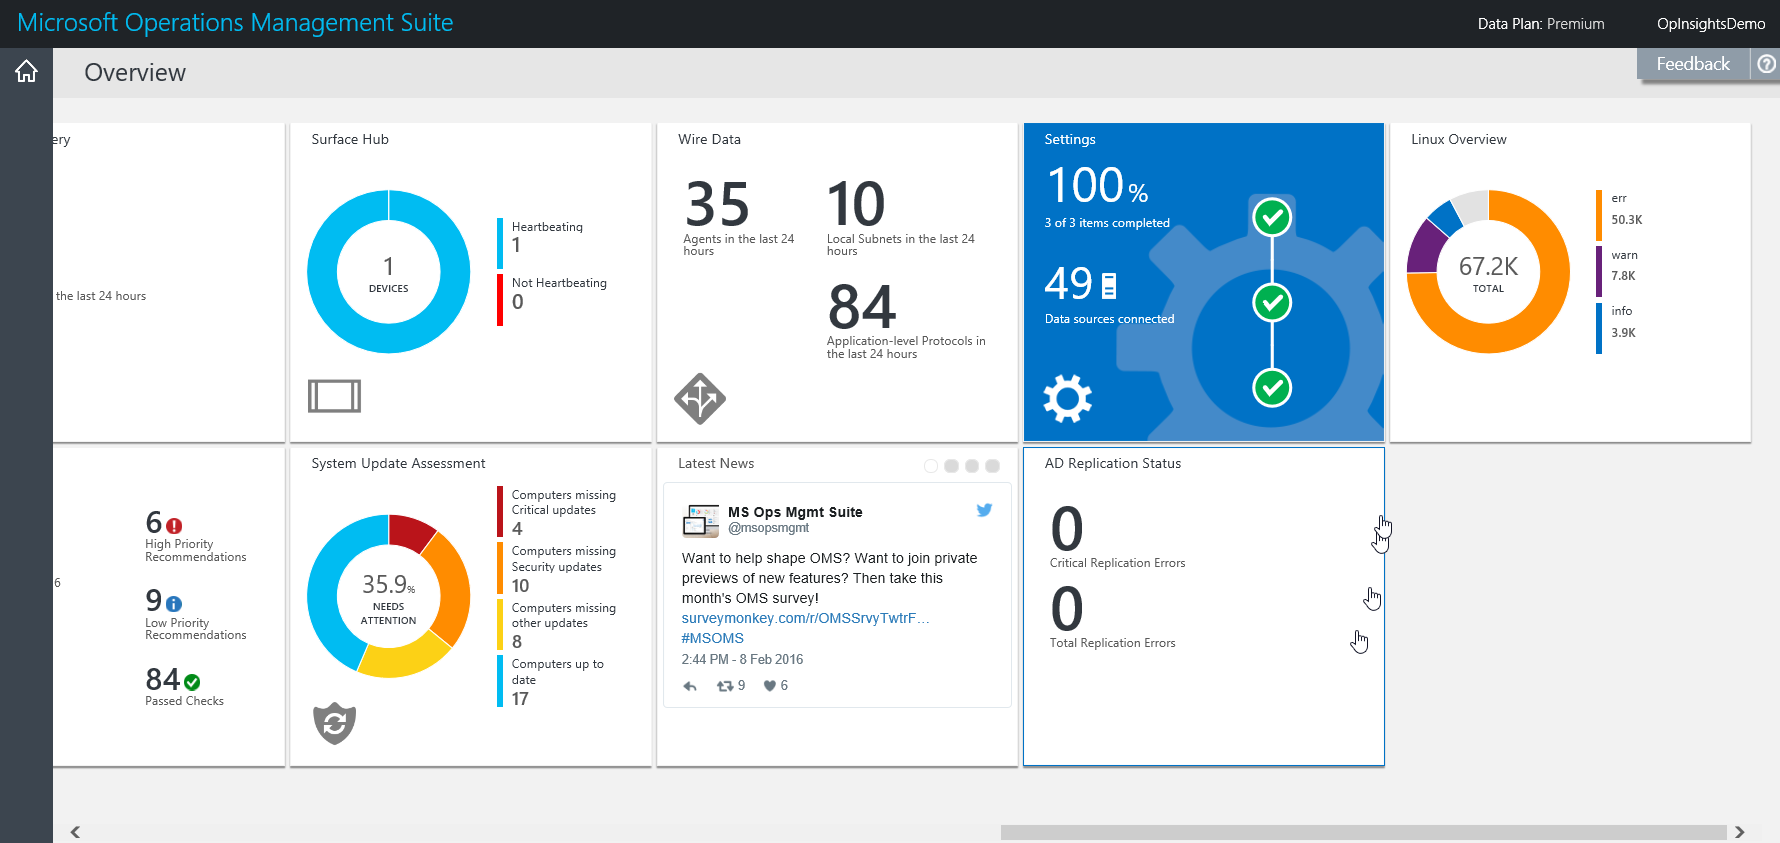
To enable near real-time performance data collection, I click the Settings tile from my Microsoft Operations Management Suite Overview screen:
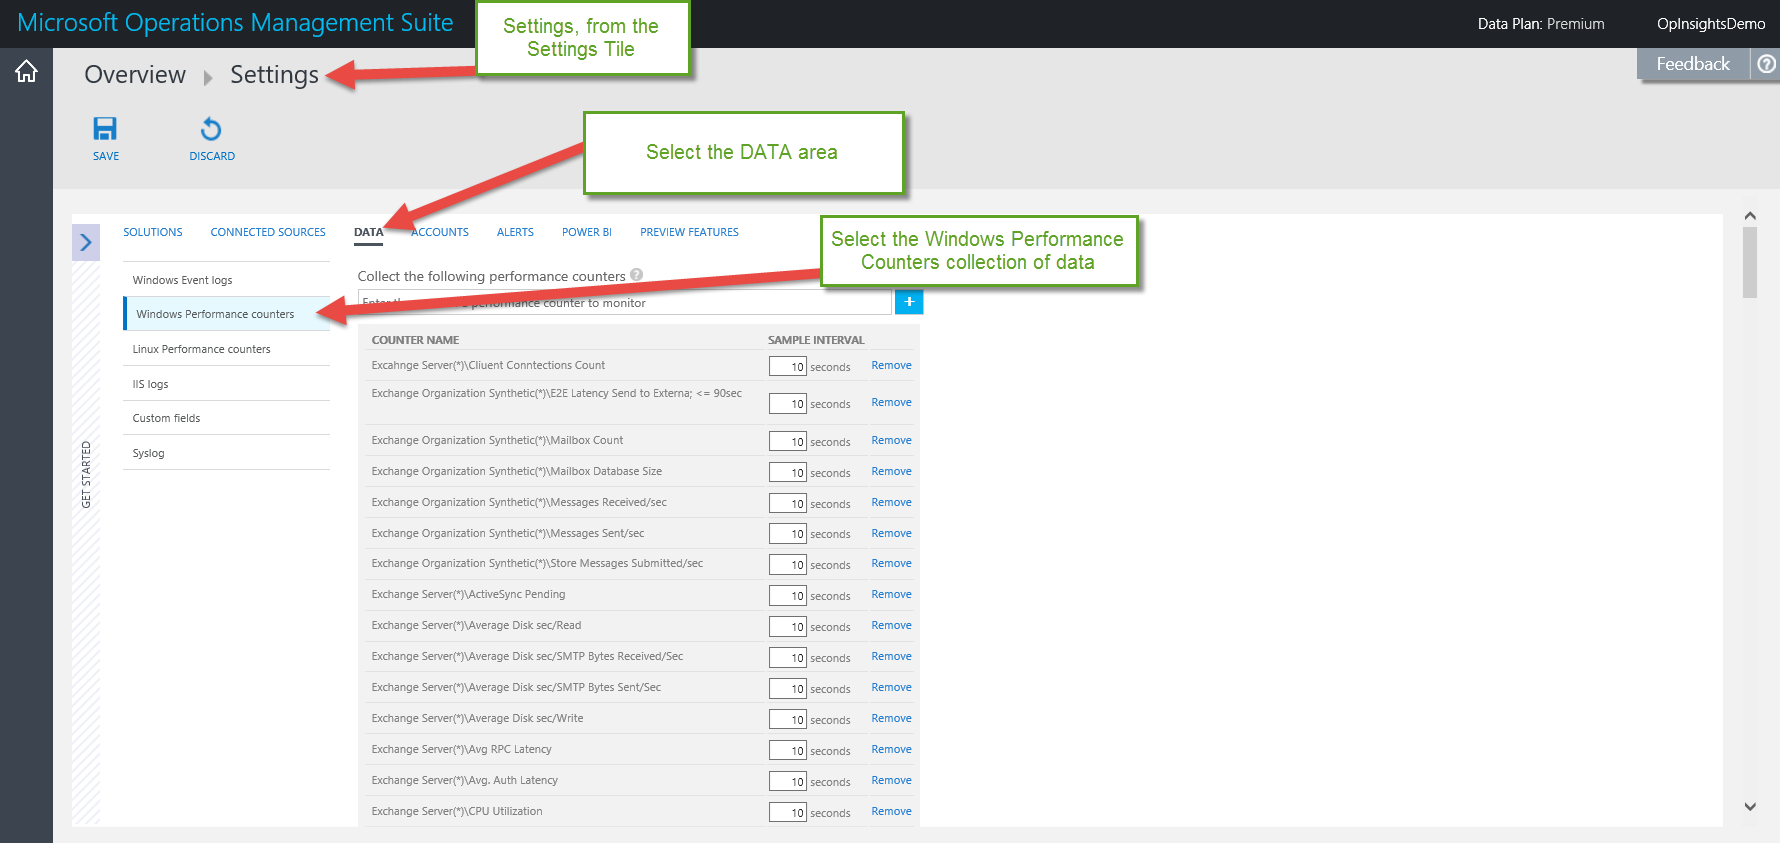
On the Settings screen, I select Data and the Windows Performance Counters data source:
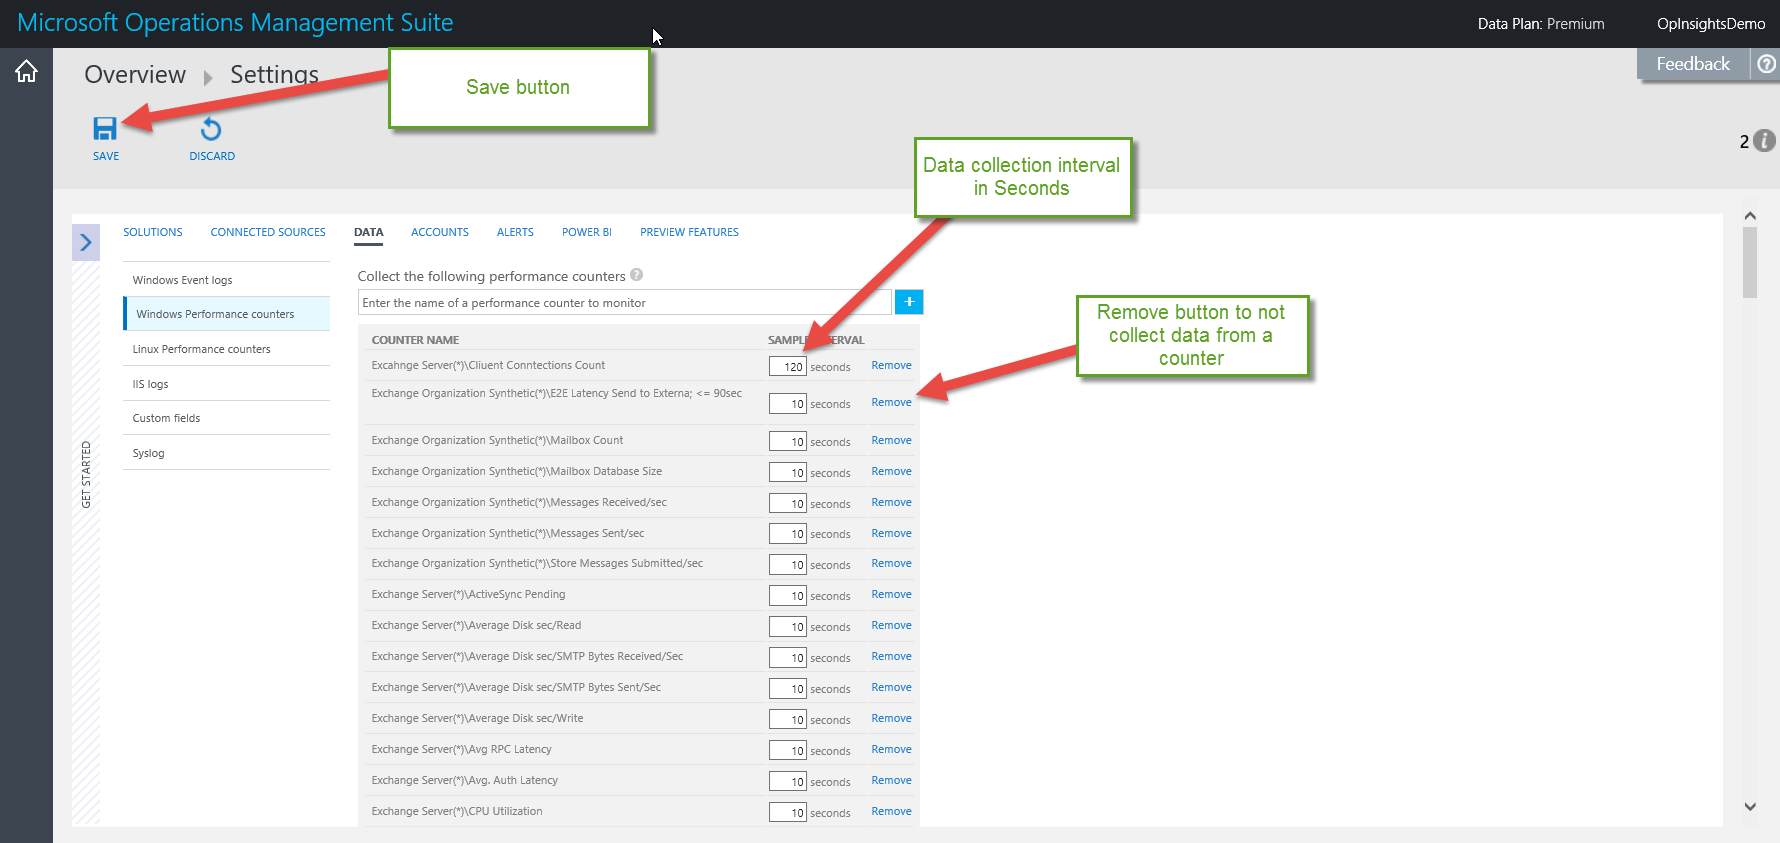
In the Windows Performance Counters area, I can set the sample interval in seconds beside the specific counter. Remember, the lowest interval I can set is 10 seconds. If I try to enter a number that is smaller (for example 5 seconds) no error generates, but the number automatically reverts to 10 seconds. All numbers in this panel are in seconds. So if I want to collect a value every two minutes, it would be 120.
I then save the configuration change by clicking the Save button. If I do not want to collect a counter, I select Remove. This is shown here:
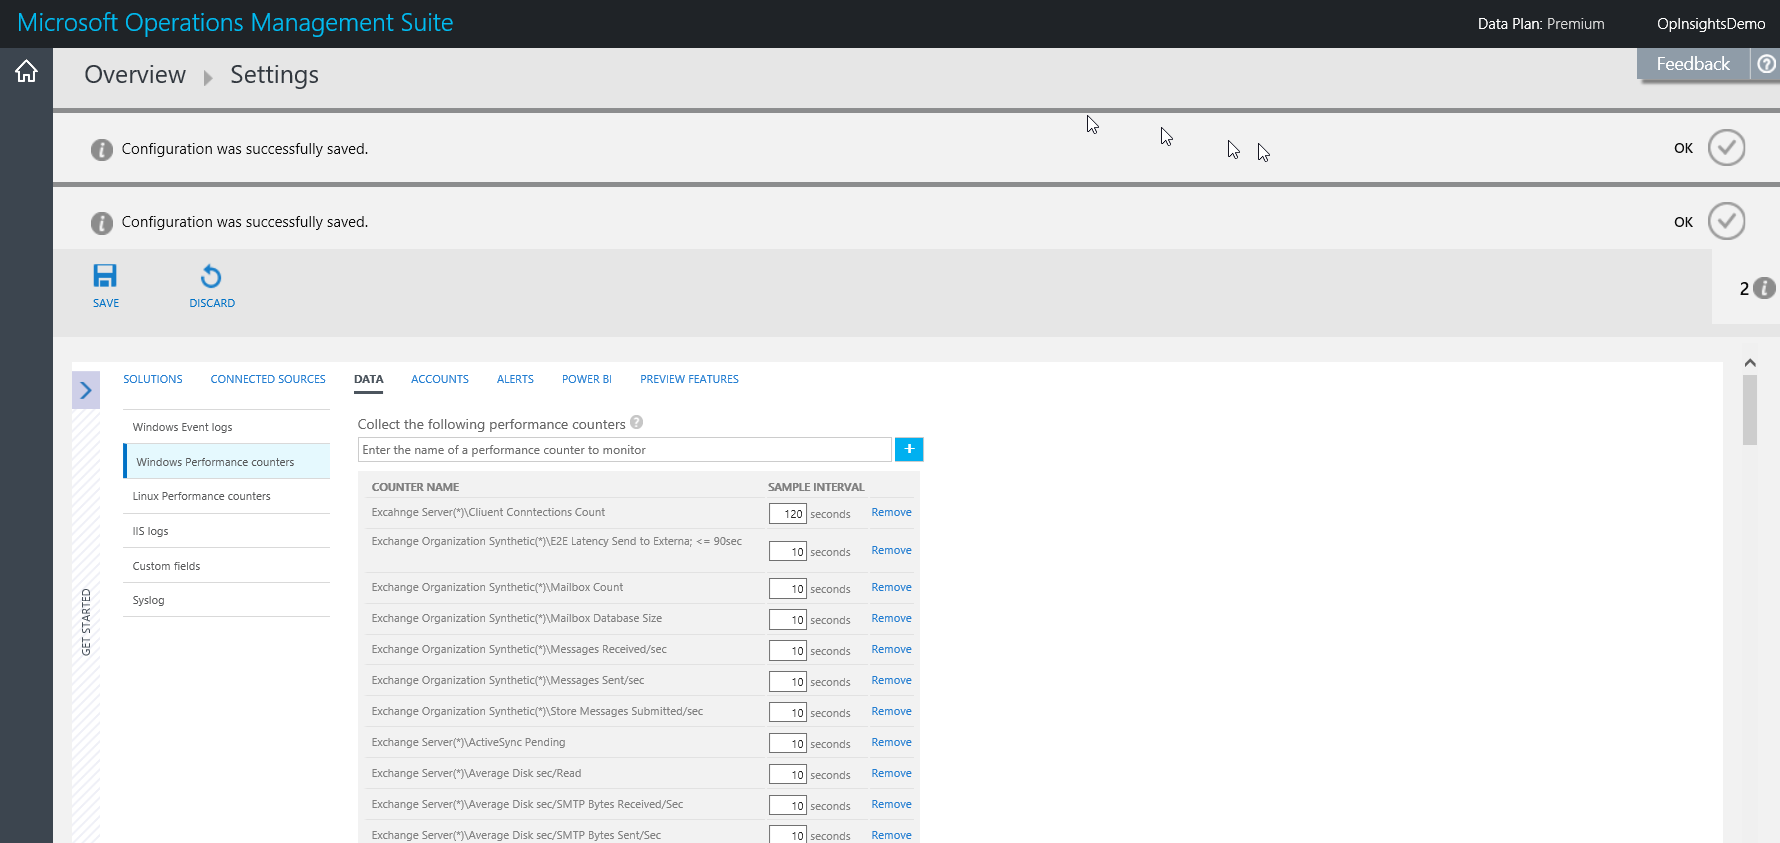
After I save s configuration change, an i appears in the upper-right corner. I click it and it tells me if the change was successfully saved. I can then click OK and it will remove the informational. This appears here:
If I want to add a particular performance counter, I type my interest in the text box above the list of performance counters. The box is intelligent, and will return search items as I type. The following list appears when I pause after typing LogicalD:
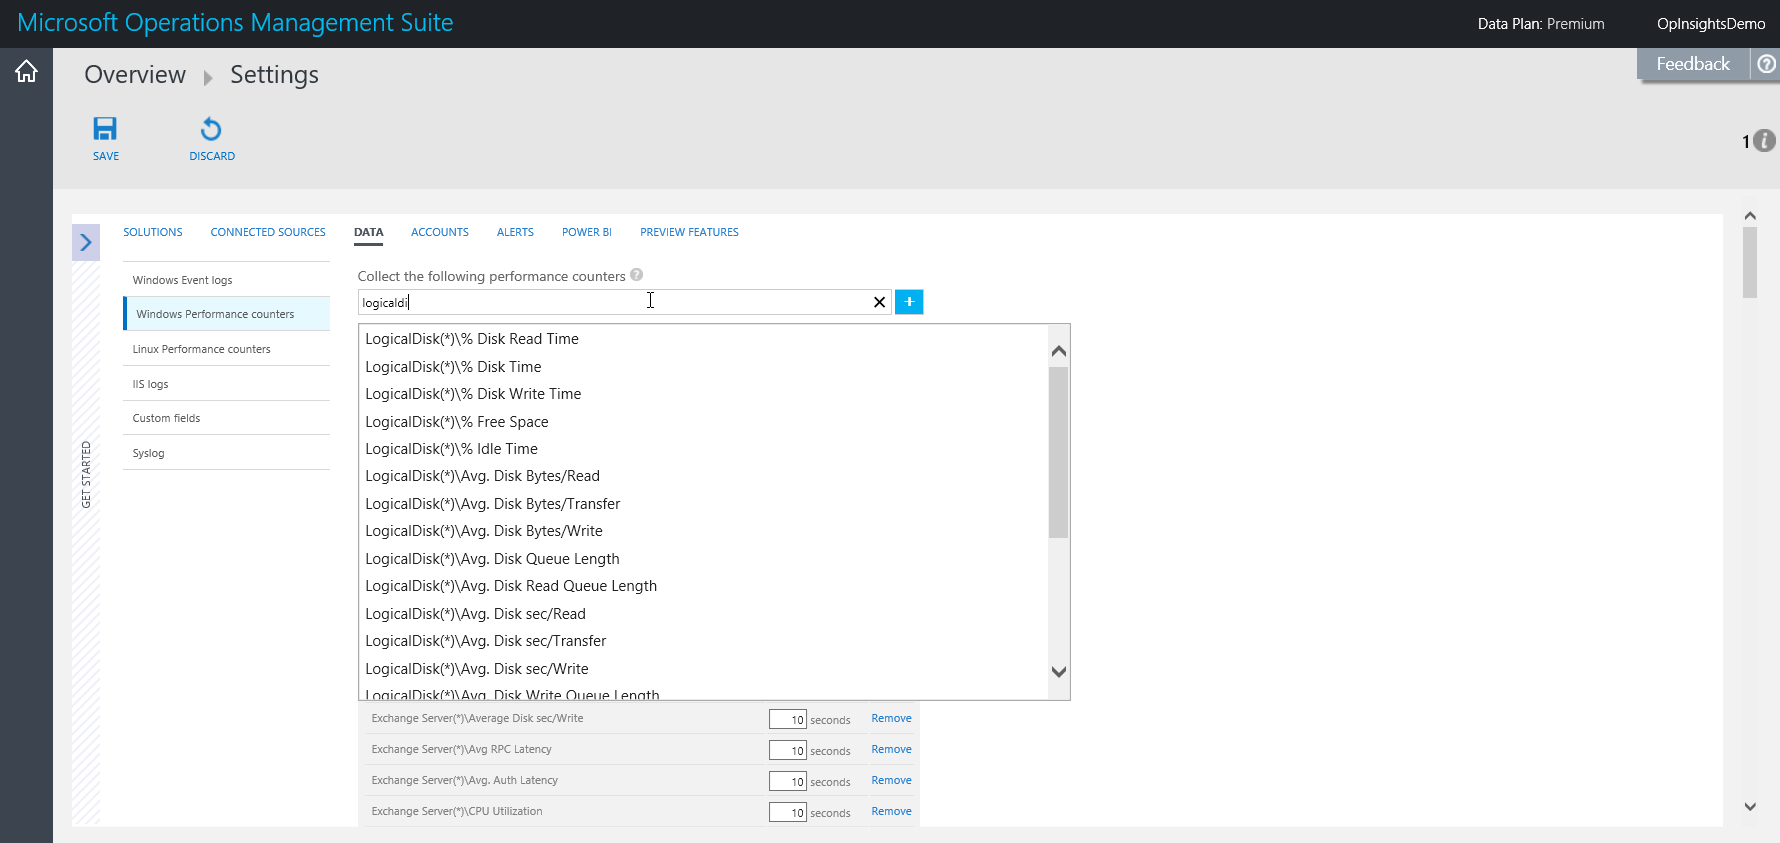
When I select a counter from the list and click the blue + sign, it is added to my list of performance counters. But I still need to scroll down to set the collection interval time. As you can see here, OMS makes it easy to find the new addition by highlighting it with a purple bar:
After I set everything, I need to save my configuration changes, and then check the informational message to make sure everything is groovy.
That is all I have for you today. Join me tomorrow when I’ll continue talking about near real-time performance data collection.
I invite you to follow me on Twitter and the Microsoft OMS Facebook site. If you want to learn more about Windows PowerShell, visit the Hey, Scripting Guy! Blog. If you have any questions, send email to me at scripter@microsoft.com. I wish you a wonderful day, and I’ll see you tomorrow.
Ed Wilson
Microsoft Operations Management Team