Super simple alert management with Operations Management Suite
Summary: Ed Wilson discusses how to use Microsoft Operations Management Suite for powerful alert management results.
Good morning everyone, Ed Wilson here. The weather here in central Florida has been great. A little cool, but beautiful. The Scripting Wife, PowerShell MVP, Teresa Wilson, and I decided to head to Disney World to meet up with and old high-school friend. While we were there, the Scripting Wife ran into a couple of her favorite buddies. She is a huge fan. Luckily I was able to capture the moment with my Windows Phone. Here she is with Pooh and Tigger:

Speaking of fans…I am a huge fan of the Alert Management solution in the Microsoft Operations Management Suite. (OK…that was sort of a weak transition.)
Alert Management provides quick overview
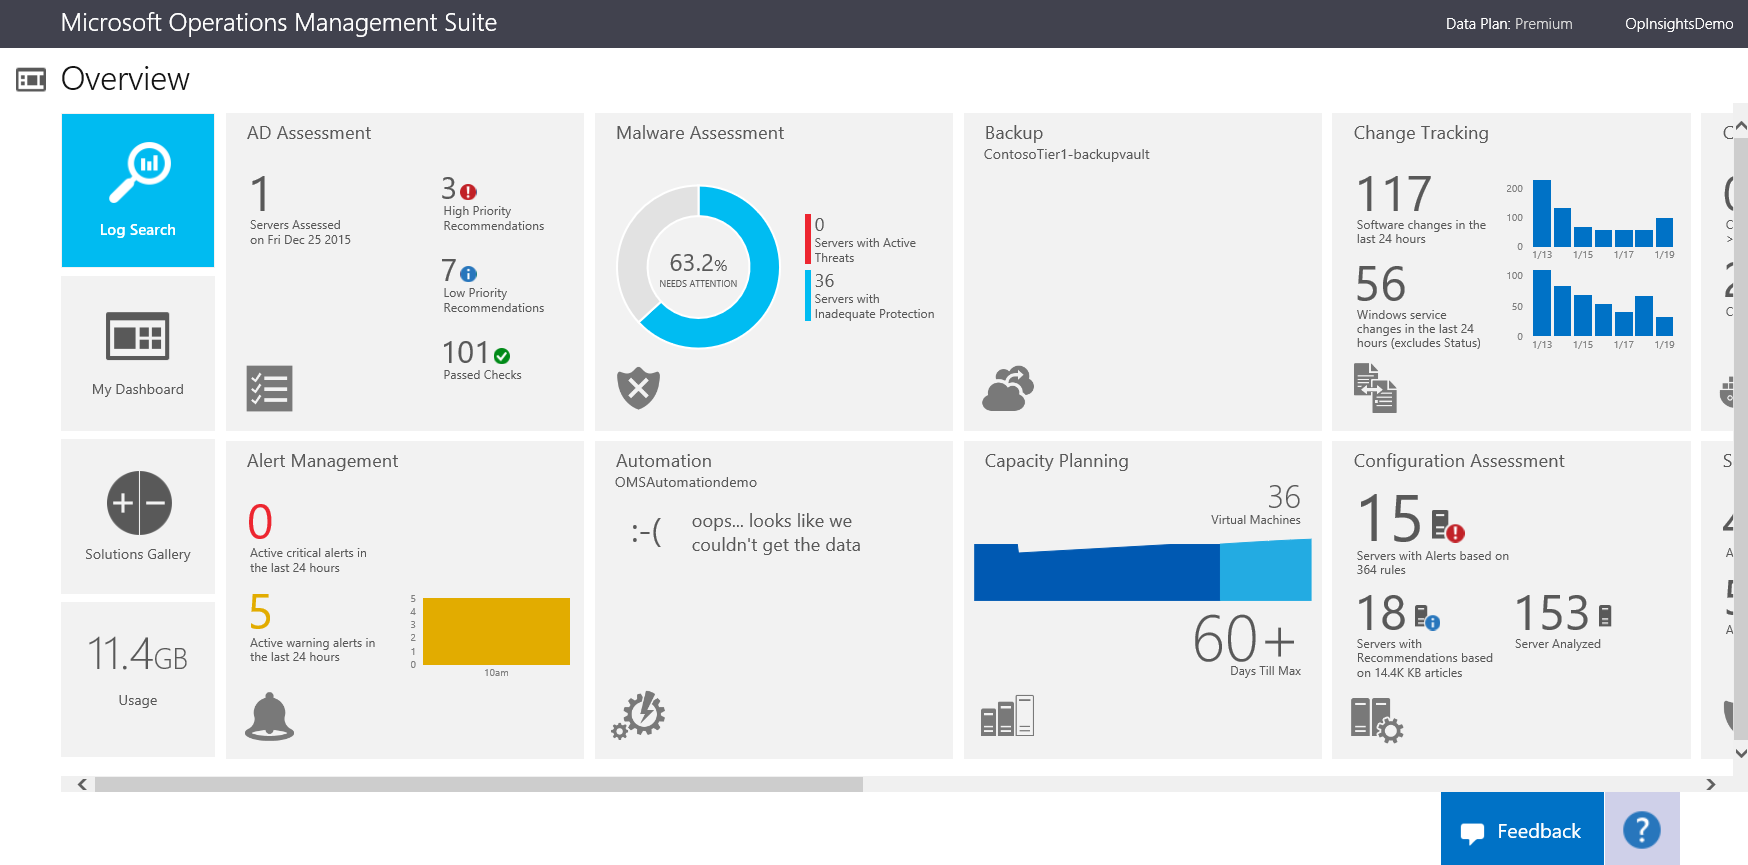
On my console in Microsoft Operations Management Suite, I can get a quick overview of alerts from the last 24 hours. This is great, and it lets me see at a glance whether I need to focus any immediate attention on my alerts. Here is the Overview page:
Dive in to the alerts
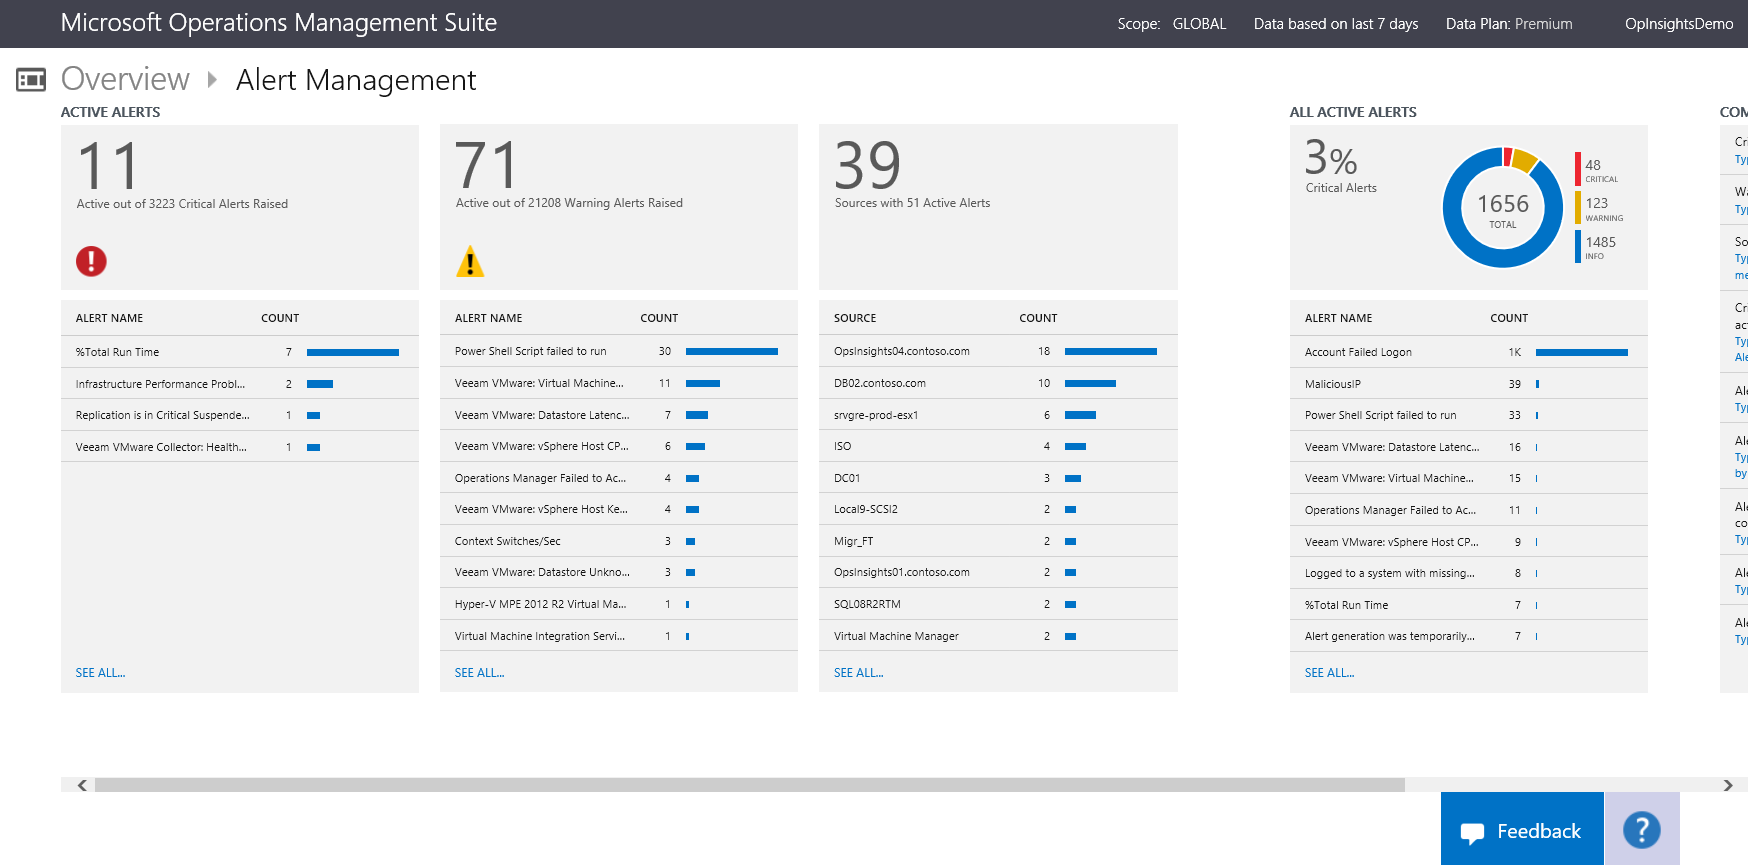
When I click the Alert Management overview tile, I am taken into a screen that shows Active Alerts. I can dive into the critical alerts, or I can look at the warnings or the sources that are raising the active alerts. I also have a nice overview that tells me which alerts are critical, the warning level, and the name of the specific alerts and ranking. It is quite detailed, and it works great for collecting the alerts from many systems and providing a quick summary.
Examine critical alerts
The following image of the screen tells me that I have 11 critical alerts, and in my case, this is out of 3223 alerts that have been raised. Of these 11 alerts, 7 are due to total percentage of runtime, and two are infrastructure performance issues. Also one is a replication issue and one is related to the Veeam VMWare collector.
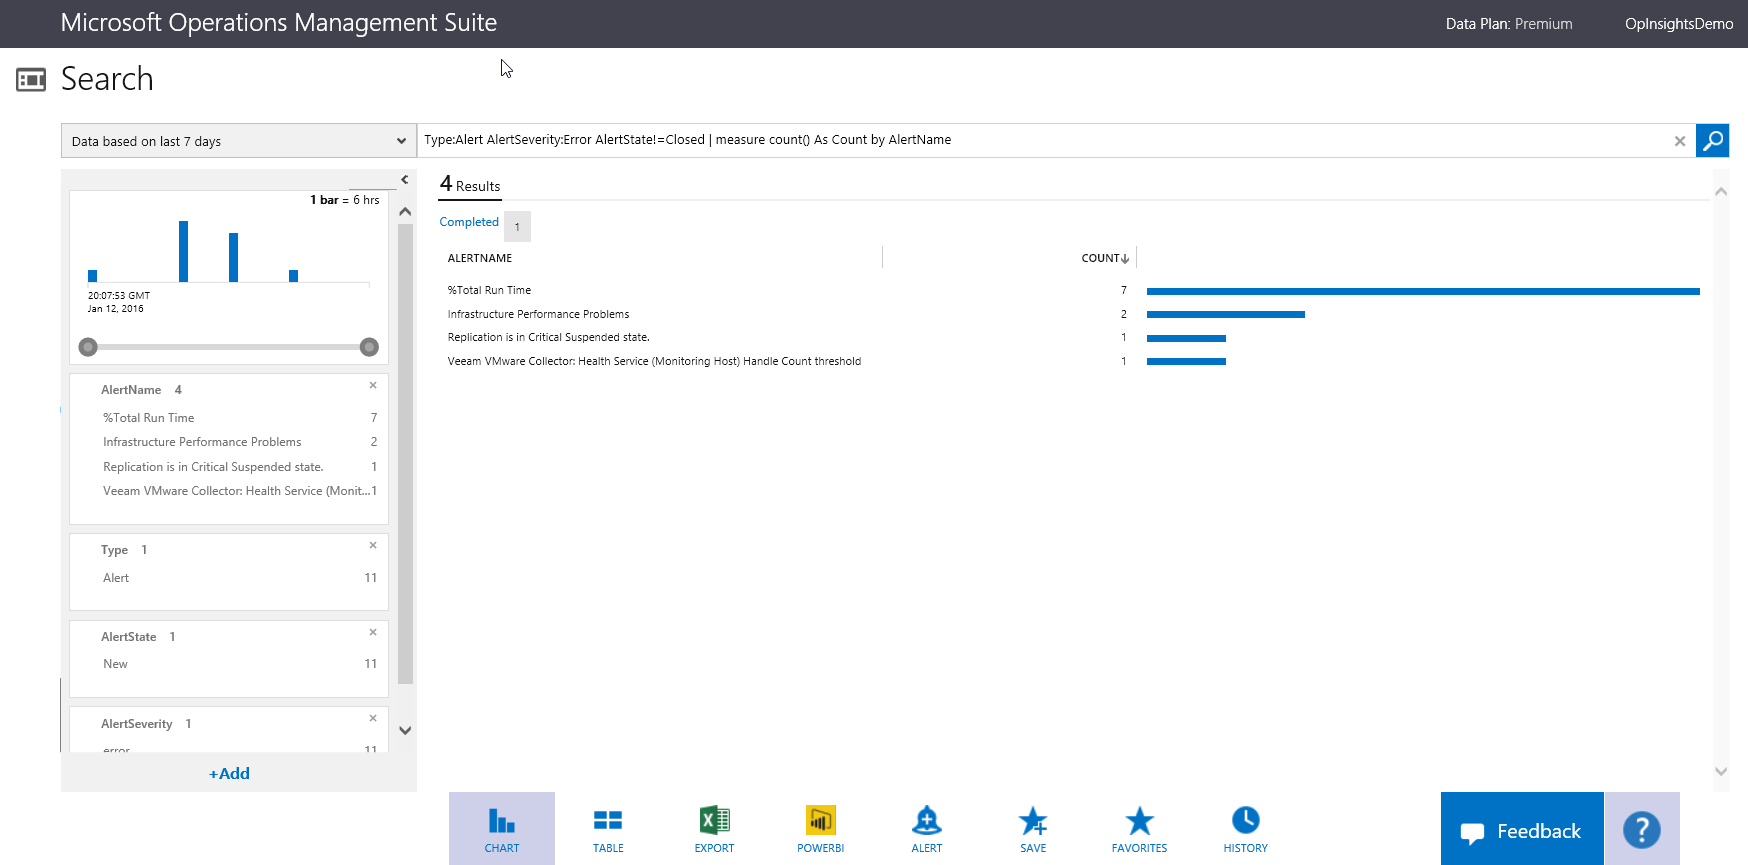
I click Critical Alerts, and I am taken to a screen that breaks down the four categories of alerts. I want to look at the seven % Total Run Time alerts and see what is going on there:
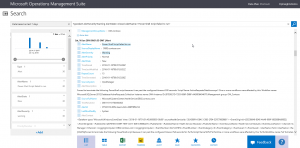
After I click %Total Run Time, a screen shows me each alert in total detail. If I click Show More under the first alert, I can see more about the alert:
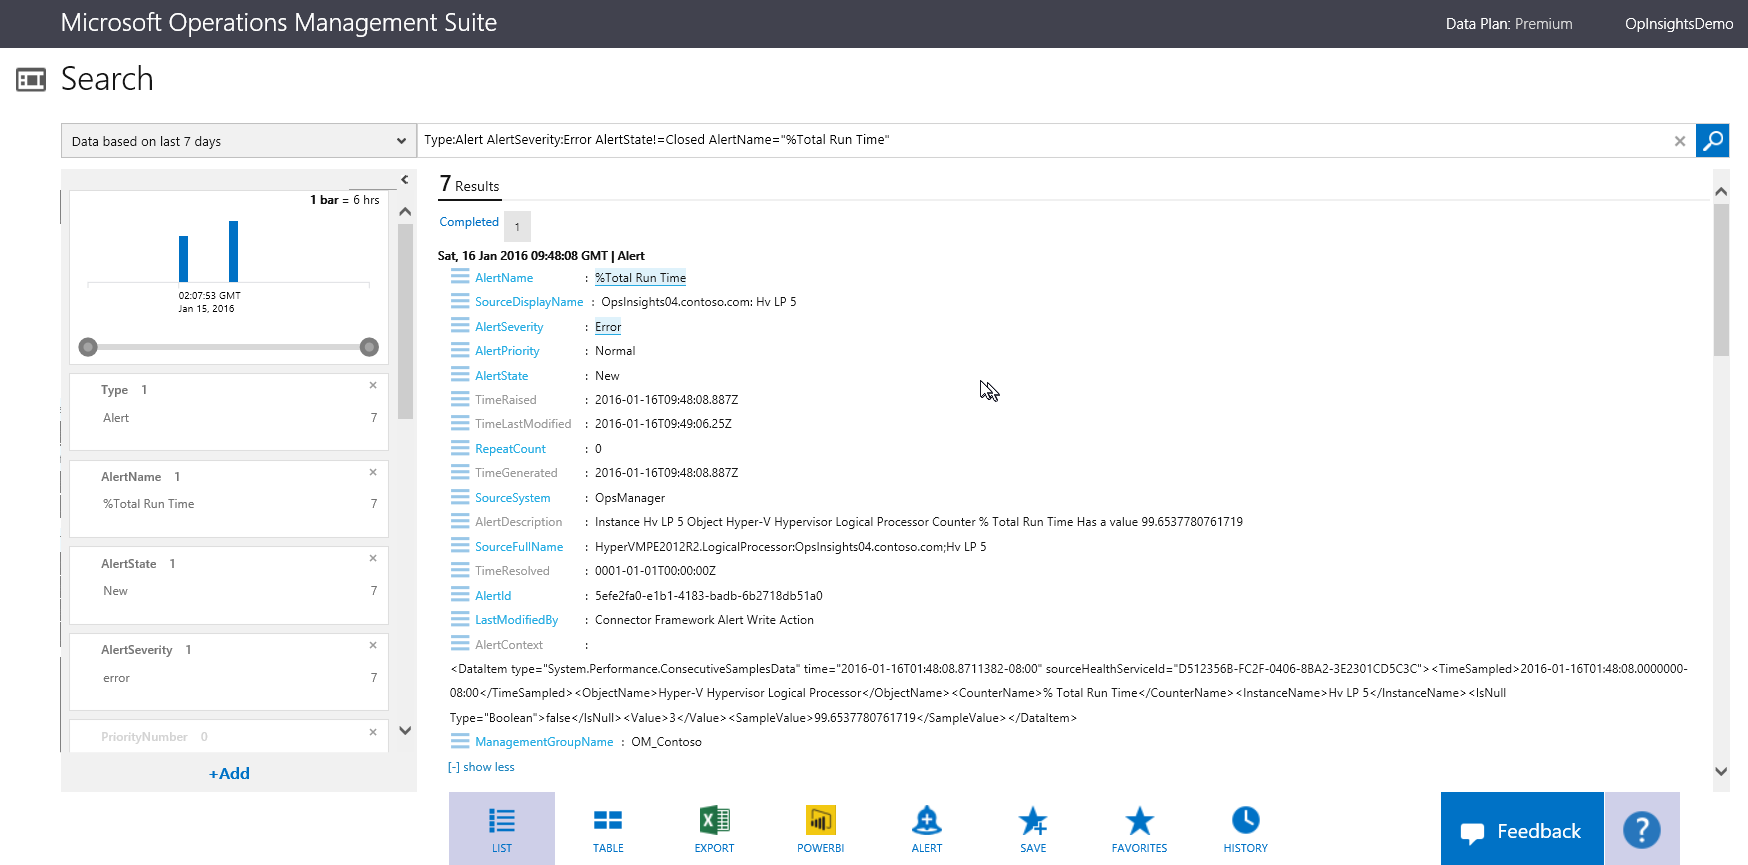
Ah! I see that I have a Hyper-V Hypervisor Logical Processor counter that has a % Total Run Time value of 99.6xxxxx. It is coming from OpsInsights04.Contoso.Com and it is instance HV LP 5.
I can open this information in an Excel spreadsheet. This allows me to zoom in to only that information, and I can see if all 7 of these alerts are related to the same thing:
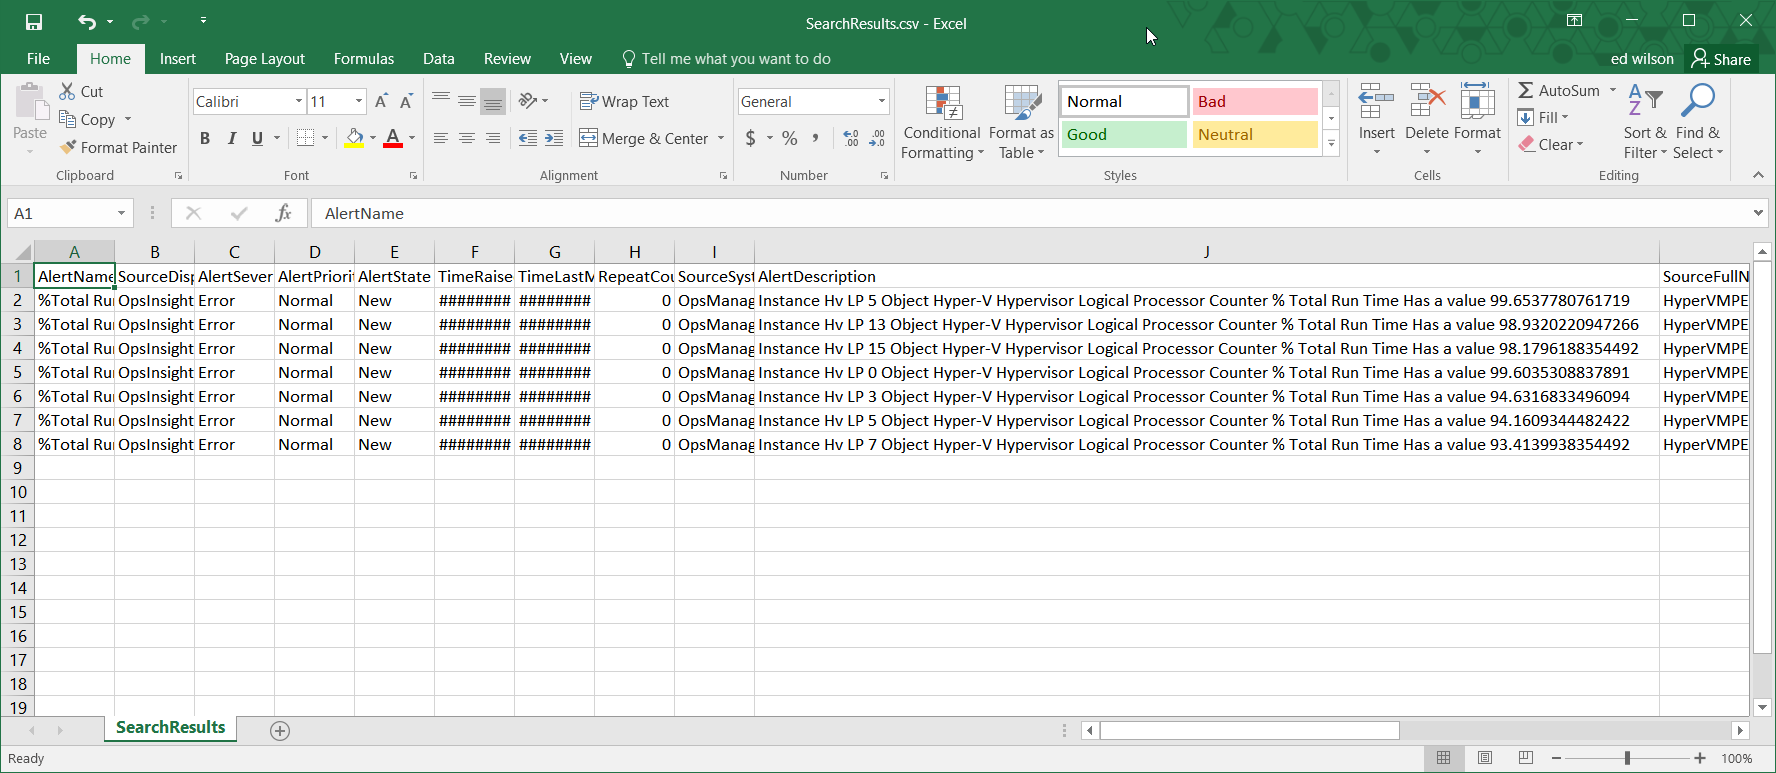
In fact, it does seem that all these are the same types of alerts; however, they are related to about five different Hyper-V Hypervisor logical processor counter instances.
Look at warnings
So, I look at the Warnings, and I see that there 30 warnings related to PowerShell scripts that failed to run. Troubleshooting Windows PowerShell scripts can at times be problematic. Luckily, I can see in the detailed description the name of the Windows PowerShell script that failed.
To get to this, I click the PowerShell Script Failed to run alert, and then expand the detail screen to show more information. I then look in the details and I can see the script name that failed. Armed with this information, I know which Windows PowerShell script to look at to help determine why it failed. One such alert is shown here:
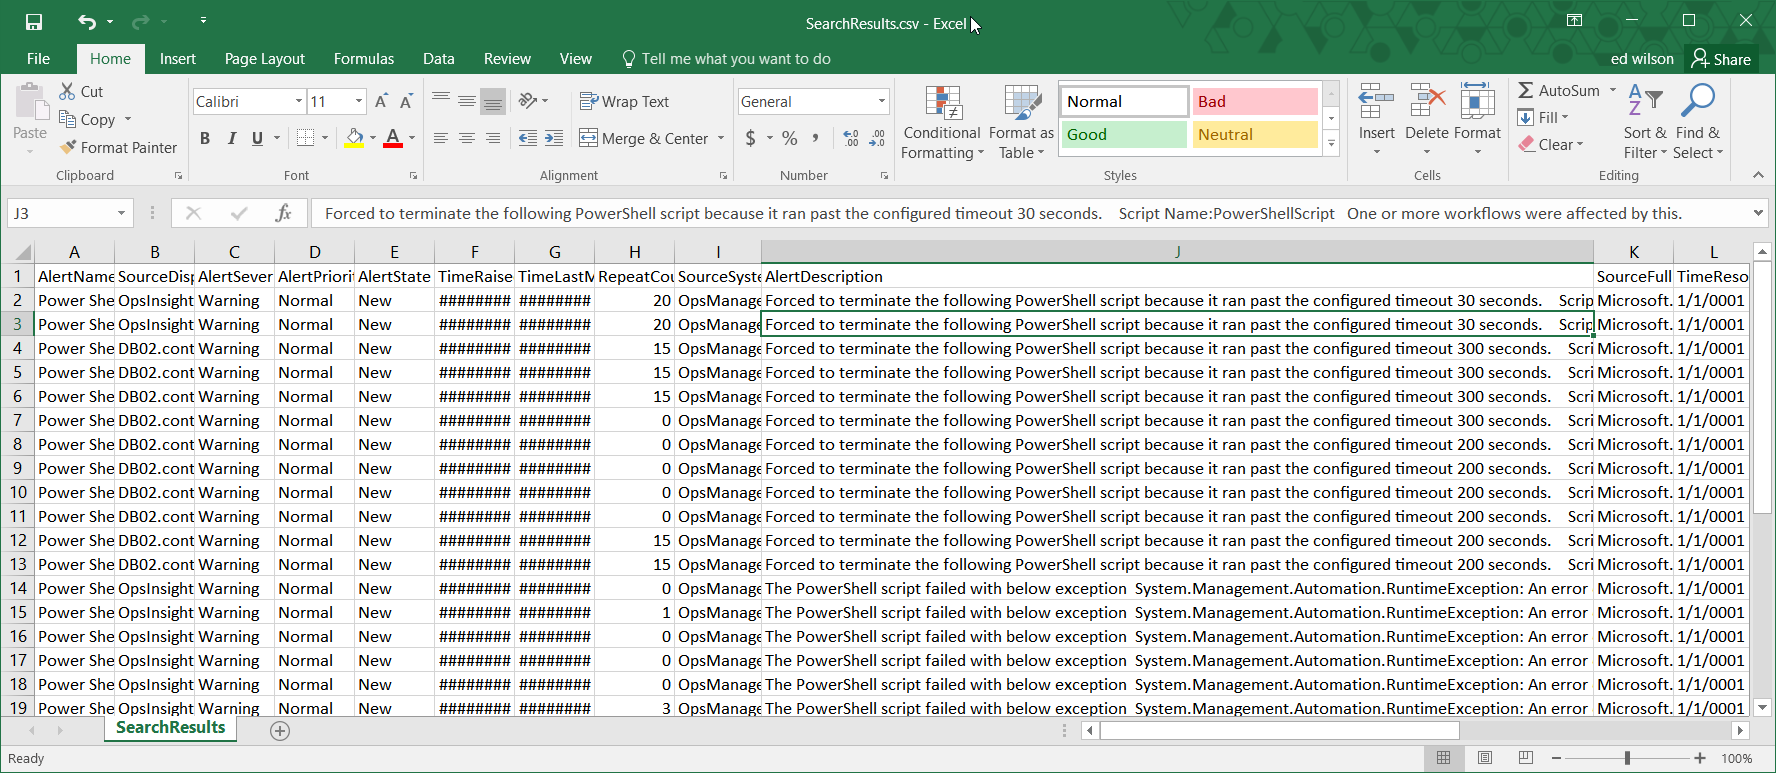
I can also export the 30 alerts and open them in an Excel spreadsheet. I can examine the AlertDescription field to see why my Windows PowerShell scripts are failing. In the following spreadsheet, I can see that there are a couple of reasons. The top half of the spreadsheet indicates the scripts are timing out.
In the first case, the script timed out after 30 seconds, so fixing this might be as simple as increasing the timeout. The third script, however, has a timeout value of 300 seconds. In that case, it might be that the remote server is simply offline. I may need to ping the server before I attempt to connect with my workflow.
Further down the spreadsheet, I see Windows PowerShell scripts failing because it could not create the pipeline. That may be due to an error in the script; it may be because an object is not being properly created; or it may be that the query is returning no objects, and therefore, there is nothing to send over the pipeline. Anyway, I at least have a place to start my investigations.
That is all I have for you today. Join me tomorrow when I’ll talk about more groovy #MSOMS stuff.
I invite you to follow me on Twitter and the Microsoft OMS Facebook site. If you want to learn more about Windows PowerShell, visit the Hey, Scripting Guy! Blog. If you have any questions, send email to me at scripter@microsoft.com. I wish you a wonderful day, and I’ll see you tomorrow.
Ed Wilson
Microsoft Operations Management Team