Using the Windows Performance Toolkit
Inside the new Windows Assessment and Deployment Kit (ADK) that was released back in August is a component called the Windows Performance Toolkit. I’ve talked about this at various events over the past few months, noting that you can use this kit to help identify what is causing your computers to take so long when they start up before they are usable. But people always ask “how do I do that myself”. First, I would suggest reviewing the documentation that is available online:
https://msdn.microsoft.com/en-us/library/hh162945
Some of you might have used a previous version of this toolkit, which included tools called XPERF and XPERFVIEW. This latest version includes new replacement tools (although the old tools are still around for compatibility, for those die-hard users) called the Windows Performance Recorder, WPR.EXE (command line) and WPRUI.EXE (GUI), and the Windows Performance Analyzer, WPA.EXE. The Recorder captures the events; the Analyzer displays the results. There is another utility called XBOOTMGR.EXE that takes care of one of the more complicated processes: setting up the computer so that it captures information at boot time. That’s the one we’ll want to use here.
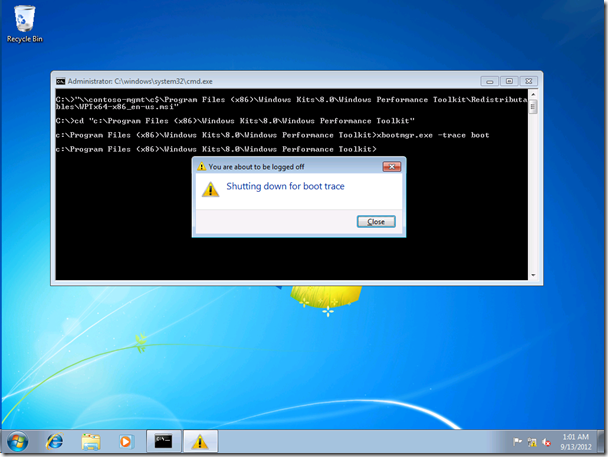
So let’s assume that you are experiencing a problem with Windows 7 computers starting up slowly. You can reproduce this at will, but it’s not immediately obvious why. So you log on to the Windows 7 computer, install the Windows Performance Toolkit redistributable from a computer that has the ADK installed (so we don’t need to put the whole ADK on the Windows 7 computer), and then run the “xbootmgr.exe -trace boot” command to get everything started:
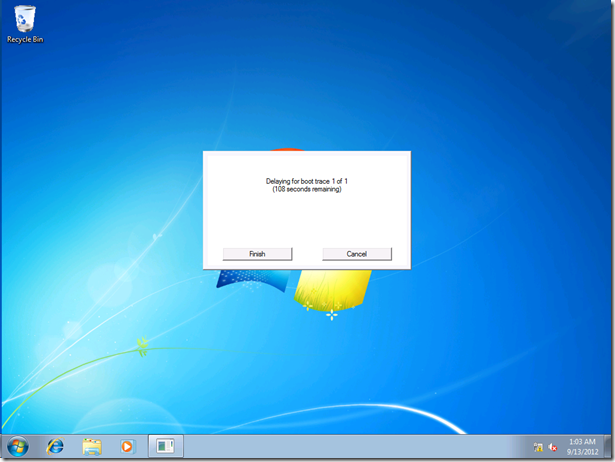
It will quickly reboot the computer, so be prepared. As soon as you can, log in to the computer to finish up the process. By default, it will wait two minutes to let the system settle down, but you can choose to end it sooner by clicking the “Finish” button:
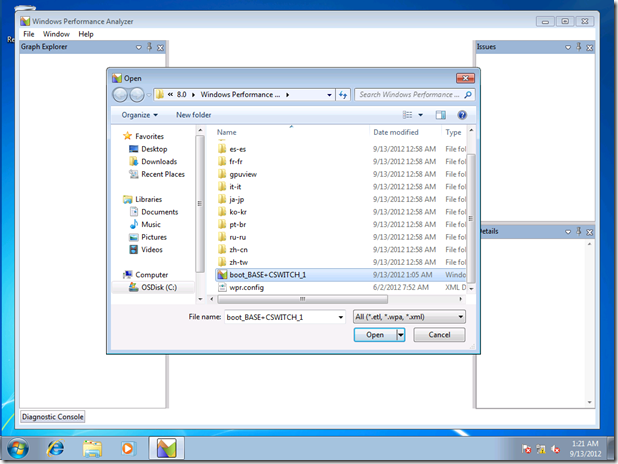
Then you can run the Windows Performance Analyzer to look at the trace; start it using the shortcut on the Start menu. (Note that it requires .NET 4.0 so if you don’t have that installed it will complain. You can always analyze the trace remotely if you want, just copy off the *.ETL file.) Once it launches, have it open the trace file that was created in the same folder we ran XBOOTMGR.EXE from:
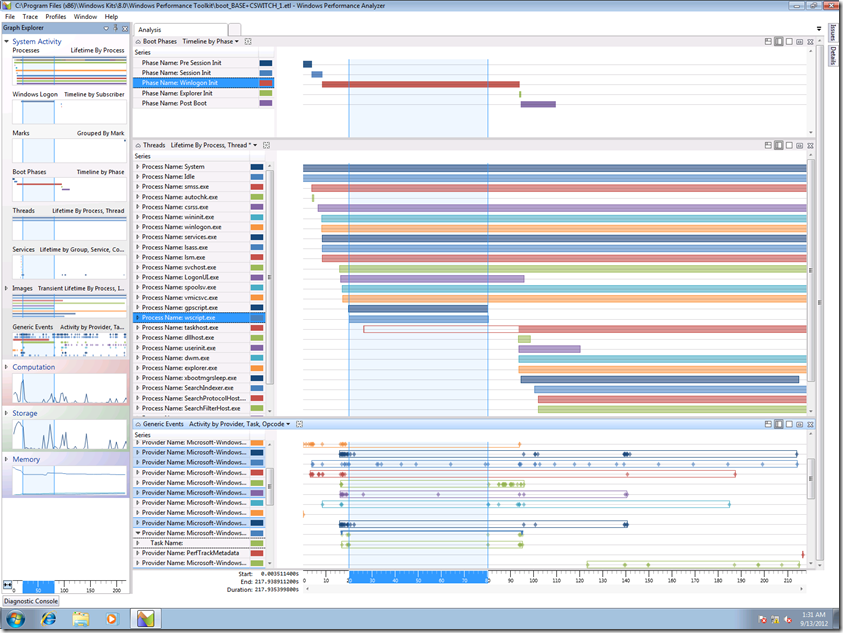
Since the Windows Performance Analyzer is very graphically-oriented, you might want to do this using a high-resolution display:
And that’s really where the fun starts: figuring out what graphs to add, what timeframes to focus on, and trying to get to a root cause. I’m no expert myself (yet), but I can see from the trace above that most of the time was spent in the Winlogon Init process. And probably not coincidentally, most of that time corresponds to the gpscript.exe and wscript.exe process lifetimes. And farther below, we can see generic events from Group Policy that confirm group policy processing took about a minute. So what was going on in this case? A bad startup script that took a minute to complete, combined with a policy setting that said “don’t run startup scripts asynchronously”.
Now I just need to teach myself how to better analyze these traces. Let the fun begin…


