Processor 0 increased CPU utilization
While looking on a Exchange 2010 server recently in task manager to review the amount of CPU utilization, I noticed that Processor 0 was at 100% CPU while all of the other CPUs were relatively lower compared to this processor.This type of behavior is caused by the Receive Side Scaling (RSS) feature not being enabled on the server. RSS is a feature that was first implemented back in Windows 2003 with the Scalable Networking Pack which allows you to span network traffic across multiple CPU cores. If RSS is not enabled, only *one* CPU will be used to process incoming network traffic which could cause a networking bottleneck on the server.Additional information on RSS can be found here.
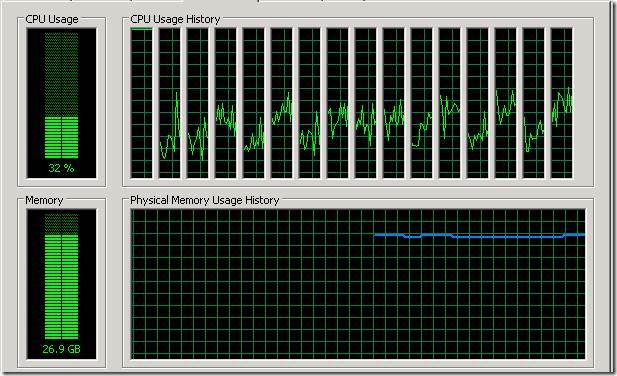
Here is what it looks like in Task Manager on the Performance tab.
As you can see, the first processor is pegged at 100% CPU which is indicative of RSS not being enabled. Generally on new installations of Windows 2008 or greater, this feature is enabled by default, but in this case, it was disabled.
Prior to enabling RSS on any given machine, there are a few dependencies that are necessary for RSS to work properly and are listed below.
Install the latest network card driver and associated Network Configuration Utility. The network card driver update is very important as older versions had known bugs that would cause RSS to fail.
Offloading features of the network card must be enabled (ie. IPv4 Checksum offload, TCP/UDP Checksum Offload for IPv4/IPv6)
Receive Side Scaling must be enabled on the network card properties
Receive Side Scaling Queues and Max number of RSS Processors must be set to the maximum value listed in the network card properties. This is typically the amount of CPU cores that are installed on the server. Hyperthreading does not count towards the max amount of CPU cores that can be leveraged here. The use of hyperthreading is generally not recommended on Exchange servers anyway and is referenced here
Note: If Receive Side Scaling Queues and Max number of RSS Processors are not changed to a value above 1, then enabling RSS does not provide any benefits since you will only be using a single core to process incoming network traffic.
RSS must be enabled at the OS layer by running netsh int tcp set global rss=enabled . Use netsh int tcp show global to confirm that the setting was enabled properly.
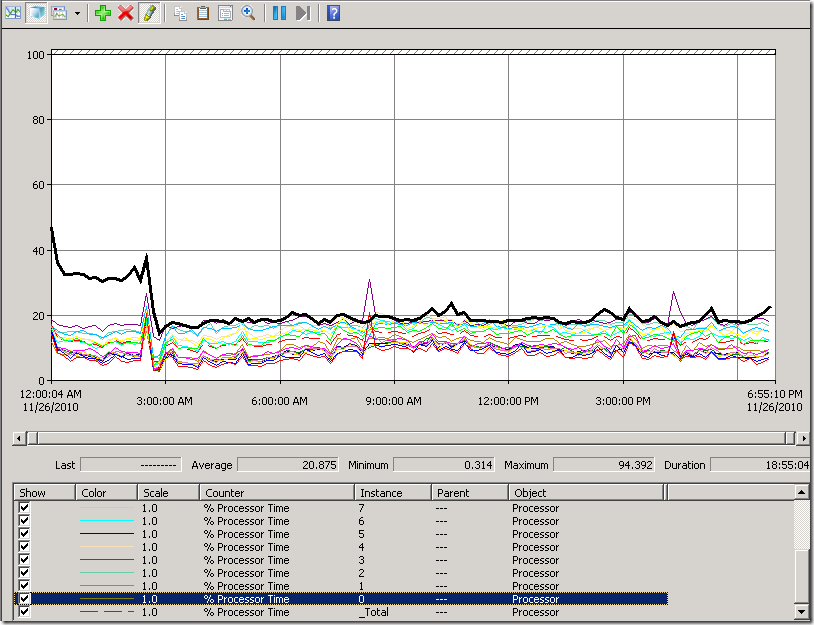
After enabling RSS, you can clearly see below the difference in processor utilization on the server as the CPU utilization for Processor 0 now fairly close to the other processors right around 3:00AM.
Many people have disabled the Scalable Networking Pack features across the board due to the various issues that were caused by the TCP Chimney feature back in Windows 2003. All of those problems have now been fixed in the latest patches and latest network card drivers, so enabling this feature will help increase networking throughput almost two fold. The more features that you offload to the network card, the less CPU you will use overall. This allows for greater scalability of your servers.
You will also want to monitor the amount of deferred procedure calls (DPC) that are created since there is additional overhead for distributing this load amongst multiple processors. With the latest hardware and drivers available, this overhead should be negligible.
In Windows 2008 R2 versions of the operating system, there are new performance counters to help track RSS/Offloading/DPC/NDIS traffic to different processors as shown below.
| Object | Performance Counter |
| Per Processor Network Activity Cycles(*) | Stack Send Complete Cycles/sec Miniport RSS Indirection Table Change Cycles Build Scatter Gather Cycles/sec NDIS Send Complete Cycles/sec Miniport Send Cycles/sec NDIS Send Cycles/sec Miniport Return Packet Cycles/sec NDIS Return Packet Cycles/sec Stack Receive Indication Cycles/sec NDIS Receive Indication Cycles/sec Interrupt Cycles/sec Interrupt DPC Cycles/sec |
| Per Processor Network Interface Card Activity(*) | Tcp Offload Send bytes/sec Tcp Offload Receive bytes/sec Tcp Offload Send Request Calls/sec Tcp Offload Receive Indications/sec Low Resource Received Packets/sec Low Resource Receive Indications/sec RSS Indirection Table Change Calls/sec Build Scatter Gather List Calls/sec Sent Complete Packets/sec Sent Packets/sec Send Complete Calls/sec Send Request Calls/sec Returned Packets/sec Received Packets/sec Return Packet Calls/sec Receive Indications/sec Interrupts/sec DPCs Queued/sec |
I hope this helps you understand why you might be seeing this type of CPU usage behavior.
Until next time!!
Mike

