Office 365 License Reporting
UPDATE 2014/14/09: New version 0.6 has been released to support Power BI for Office 365 licenses.
I’ve been looking for some way of reporting on Office 365 licenses assigned to users and creating a simple Pivot Chart to get an overview of the licenses.
There are alot of PowerShell scripts out there, but the ones I found didn't really fit my requirements.
I decided to throw something together to help me with my requirements ,nothing fancy, but I came with the following.
Basically, I’m using Excel to call PowerShell to export the raw license data to CSV. Once the export process has finished you just use the import button to import the CSV into the Excel sheet. The Pivot Chart will then update with the relevant data.
The Chart will look like this:
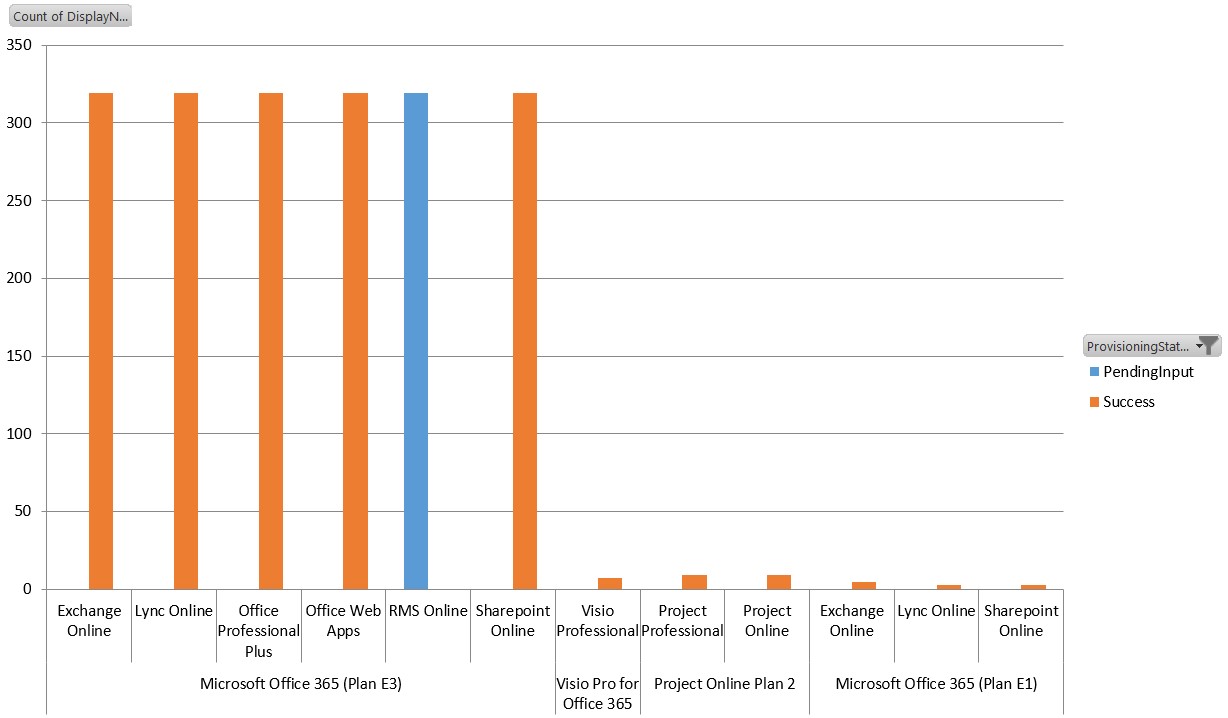
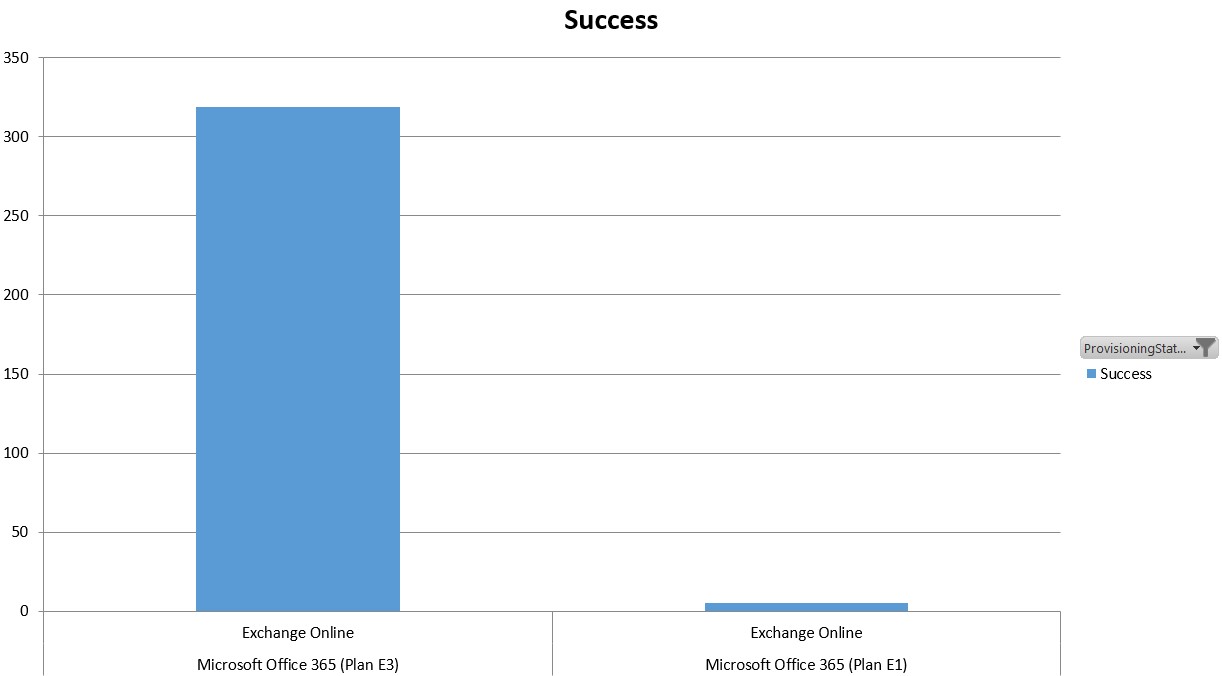
You can manipulate the Chart by filtering on AccountSKU, ServiceName and ProvisioningStatus.
I re-used some code in the PowerShell from Alan Byrne's script, but I needed the licensing data in each row to create a report on different SKU’s. So my script basically loops through each user and export SKU’s and Service names against every user.
I hope this helps you to get an overview on your licenses assigned on your tenant.
You can download the tool here
This requires the Windows Azure PowerShell module to work.
I also included this feature in my Migration Management tool to help keep track of licenses during a migration.
If you have any feedback, don’t hesitate to ping me at technicalramblings@outlook.com
Until next time,
Michael Hall (MCS)