Creating an Alert View to Group Alerts Generated by Monitors Versus Rules
In OpsMgr 2007 and 2012, alerts are generated by either monitors or rules. Monitors are used to represent the health of a component while rules are generally used to collect data, yet they can generate alerts as well. Many OpsMgr operators that focus their efforts on resolving issues in their environment often do not make the distinction between the two mechanisms for generating alerts and will sometimes close long standing alerts to “see which alerts are being raised again”.
The TechNet library has a good entry on the impact of closing alerts generated by monitors or rules, but here’s the crux of it:
- Closing alerts generated by rules is generally ok. If the alert condition still exists, the alert will be raised again.
- Closing alerts generated by monitors will not be raised again if the condition still exists.
Manually closing alerts raised by monitors is generally bad practice. Monitors will not raise an alert again unless their state goes back to healthy then to unhealthy.
Why is this bad? Well, for one thing, the health model of a particular component goes out of sync with reality – this means that what you see in OpsMgr doesn’t reflect reality. This reduces the effectiveness of OpsMgr and the value of centralized monitoring.
The reality of many IT Monitoring teams, however, is that not every alert can be attended to, especially during periods of transition such as an influx of new servers/applications or the introduction of a new management pack (i.e., the tuning or stabilization period).
To help you during those times, wouldn’t it be nice to have an alert view that tells you which alerts have been raised by monitors and which alerts have been raised by rules? In OpsMgr 2012, you can do that thanks to widgets.
Note: in OpsMgr 2007 and later you can find this information in the alert details. In this post, however, you’ll create a view so that you can see at a glance the split between the two types of alerts.
Steps
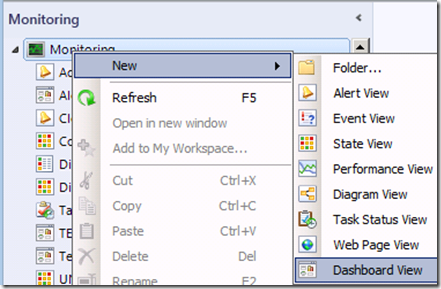
- In the OpsMgr administrator console, click on the Monitoring button and right-click on Monitoring, New, Dashboard View
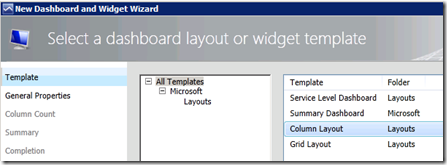
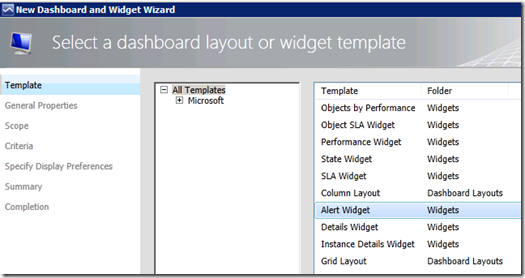
- In the Select a dashboard layout or widget template window, select Column Layout. Click Next.
- In the Enter a friendly name and description window, type a name for your view (e.g., Contoso Alerts by Type). Optionally, put in information to describe the view in the Description section. Click Next.
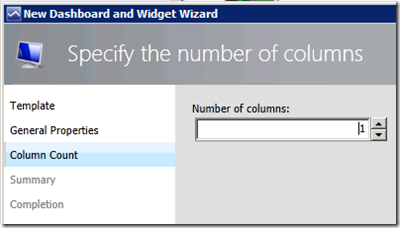
- In the Specify the number of columns window, leave the Number of columns to 1. Click Next.
- On the Summary page, click Create.
- On the Completion page, click Close.
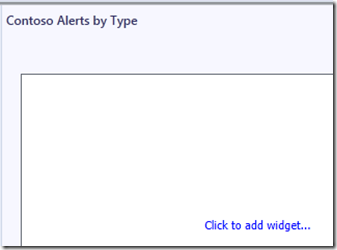
- Click on the newly created dashboard view, which will be blank, and click on the Click to add widget… link.
- In the Select a dashboard layout or widget template window, select the Alert Widget template. Click Next.
- In the Enter a friendly name and description window, type in a descriptive name (e.g., Contoso Monitors vs. Rules Alerts). Optionally, enter a description for the widget in the Description field. Click Next.
- In the Specify the Scope window, leave it to (All) . Click Next.
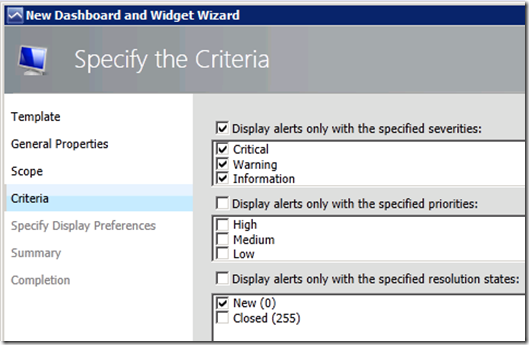
- In the Specify the Criteria window, select the desired criteria. For example, to display all open alerts, select the Critical, Warning, and Information severities along with the New (0) resolution states. Click Next.
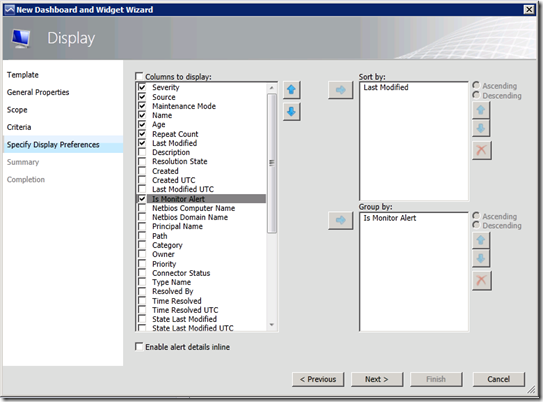
- In the Display window, select the display preferences such as severity, name, age, repeat count, etc.
- Still in the same page, select the column Is Monitor Alert and add it to the Group by field. This is the key to our view. Click Next.
- On the Summary page, click Create.
- On the Completion page, click Close.
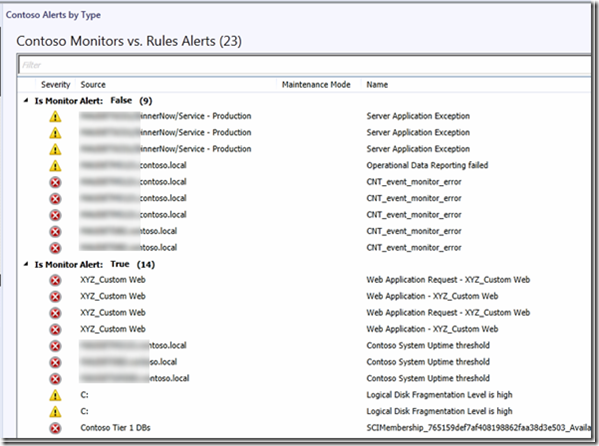
The dashboard view will now display alerts grouped by monitors (Is Monitor = True) or rules (Is Monitor = False).
This view will now help operators and support personnel triage the alerts a bit further.
Hope this helps! Comments are welcome!
