Quickly Finding Trends in Large Volumes of Performance Monitor Log Files
I’ve spent a lot of time recently trying to troubleshoot performance problems with the System drives in a 100+ Exchange Server 2013/2016 environment. As a result of a number of different factors, the System drives started failing much earlier than expected; about a year into their service life. This manifested itself in various ways, including very slow OS performance, disk failures for one or both disks in the mirror, and file and file system corruption. Once disks started to fail, some servers would get to a point where they would be unable to boot again after a reboot. Others seemed to operate fine, but would fail with corruption type errors when trying to apply Exchange Cumulative Updates, or other Hotfixes.
As a way to identify which servers were good and which had disks that were bad or failing, one approach I decided to take was using Performance Monitor, and looking at the Average and Maximum values for Disk read latency, write latency, and queuing. Specifically, I wanted to look at the "Avg. Disk Sec/Read", "Avg. Disk Sec/Write", and "Avg. Disk Queue Length" counters for LogicalDisk.
The biggest problem with doing this analysis was how to efficiently find problem counters in hundreds of PerfMon logs on hundreds of Exchange Servers, while being cognizant of the time that it took to process all those files, and the system resources (CPU, Memory, Network) used in the process. To solve this, I wrote a new PowerShell script, Get-PerfMonSummaryStats.ps1.
Get-PerfMonSummaryStats.ps1
Get-PerfMonSummaryStats.ps1 is designed to look at one or more counters in one or more Performance Monitor .blg files spread across one or more computers. With each counter that is found, the range of sample values for that counter will be measured to obtain the Average, Maximum, Minimum, and Sum of values. These values can be used to quickly identify trends in large amounts of Performance Monitor .blg files, and determine which files may warrant further investigation.
The script can be run both locally or remotely, but is designed primarily to be run remotely against many machines at once. When run Remotely, each target machine is responsible for inspecting specified counters in one or more PerfMon files, and summarizing the results. Instead of sending back the raw counter data for all the counters that are found, only summaries are sent back to the machine where the script was executed. This greatly reduces the network requirements for doing a remote PerfMon analysis.
The output of the script is a variable which contains three members: CounterSummaries, ComputerSummaries, and FileSummaries. These variables are used to store groupings of counter measurements at the counter level, computer level, and file level:
-
CounterSummaries: These contain groupings of all discovered measurements for each unique counter path. Each counter will only be listed once in this output.
ComputerSummaries: These contain groupings of the counter measurements taken from all files on each computer. For each computer, a counter will only be displayed one time.
FileSummaries: These are the counter measurements found in individual files for each computer. Similar counters will be displayed once for each counter in each file they were discovered in.
Examples
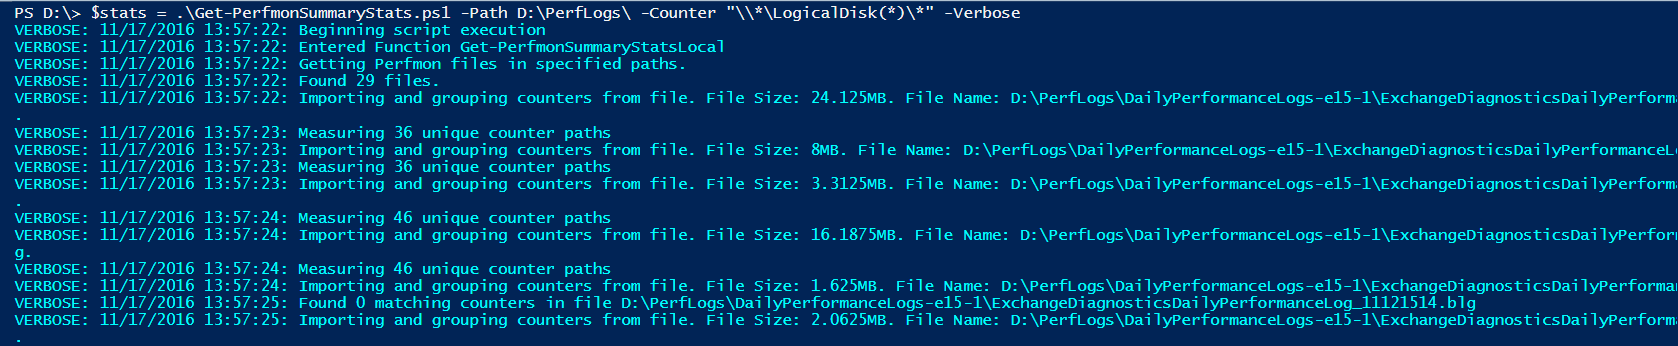
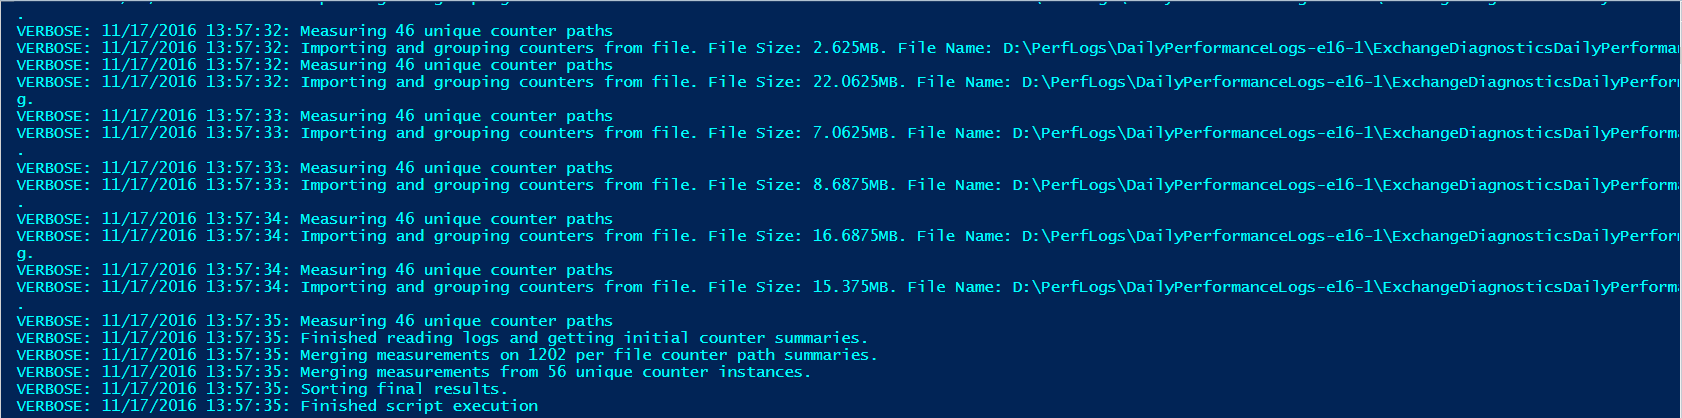
The following examples show how to analyze perfmon files, and manipulate the output variable from the script. To start with, I’m going to do a local log analysis against 29 perfmon files located in the D:\PerfLogs directory. These files were originally retrieved from two different Exchange Servers. I’m specifically asking for all LogicalDisk counters for all disks to be analyzed.
PS> $stats = .\Get-PerfmonSummaryStats.ps1 -Path D:\PerfLogs\ -Counter "\\*\LogicalDisk(*)\*" -Verbose
Next I’ll show the contents of the output variable. Note the CounterSummaries, ComputerSummaries, and FileSummaries members.
PS> $stats | fl
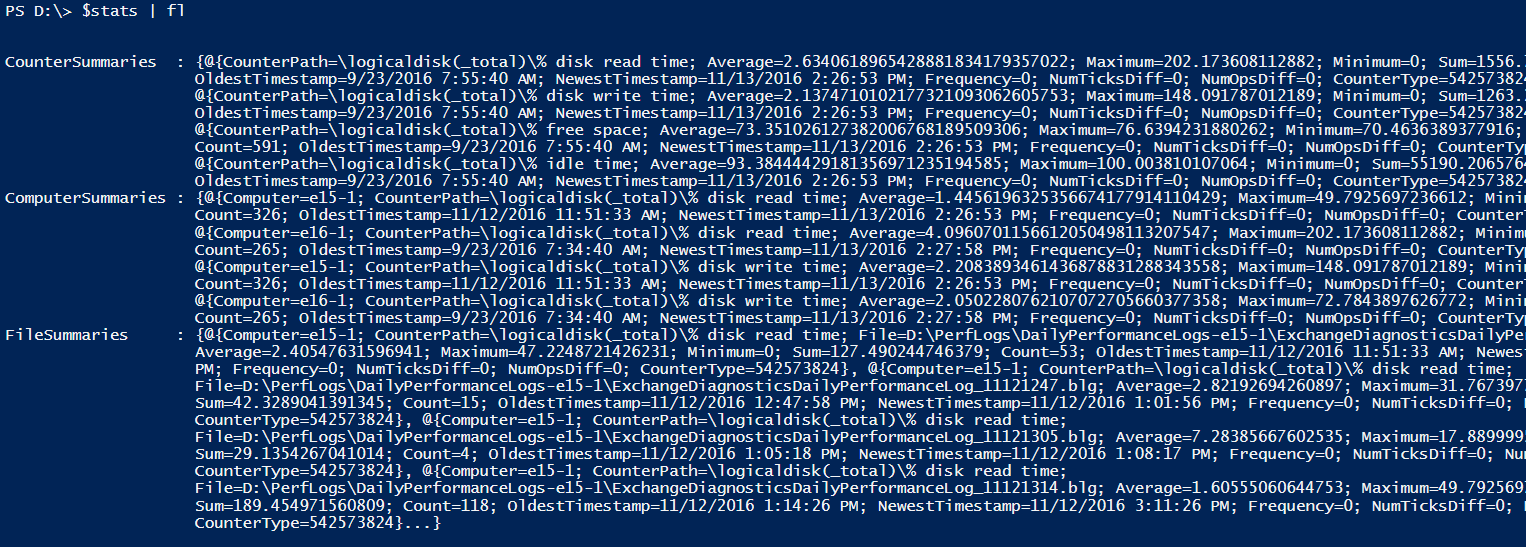
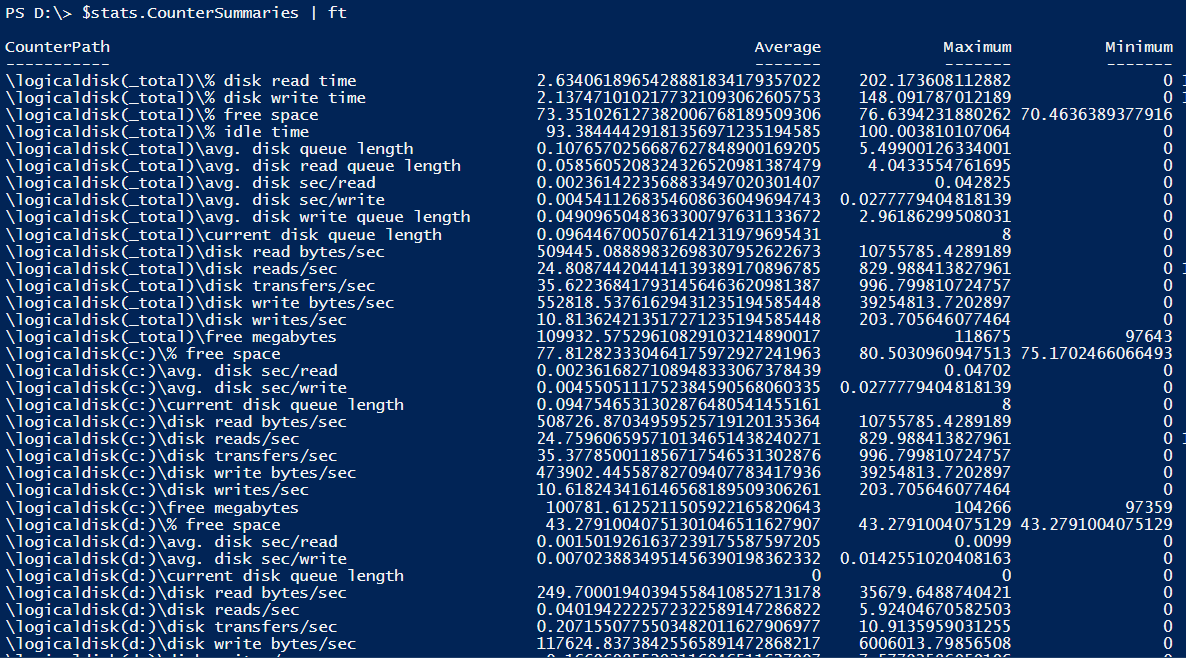
Here’s what the CounterSummaries member looks like. Note that no computers or files are listed in this output. These are the merged measurements for every counter found in every file on every computer.
PS> $stats.CounterSummaries | ft
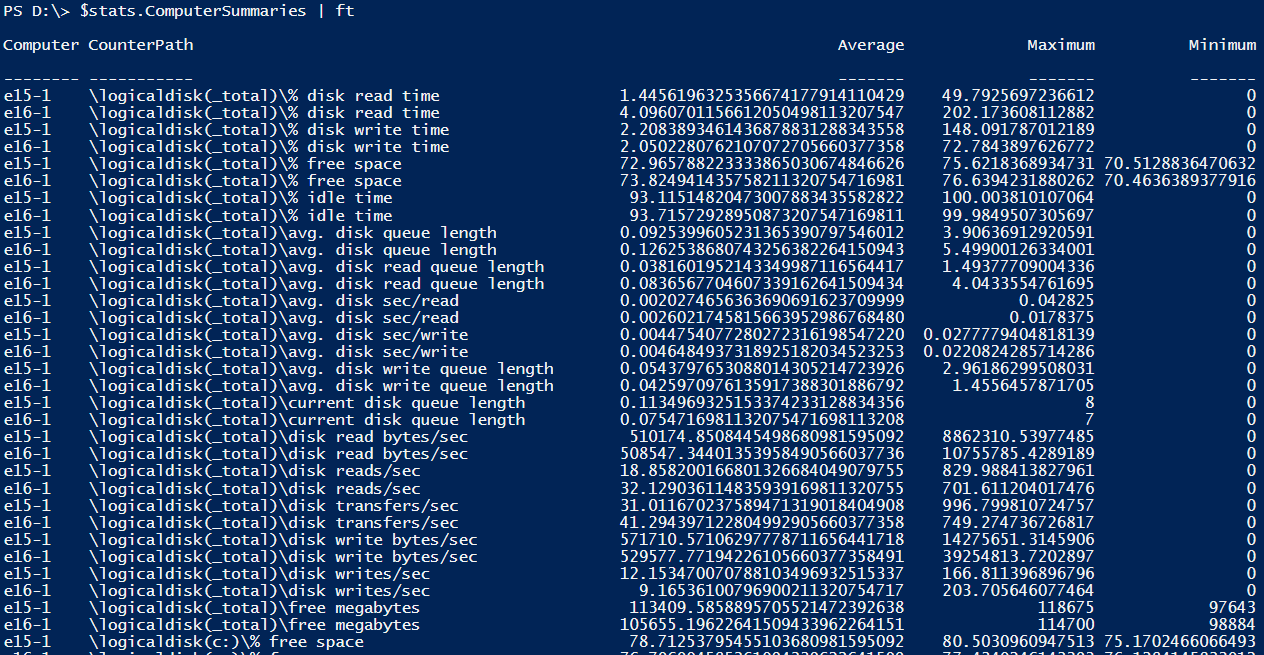
Here’s what the ComputerSummaries member looks like. Notice that each counter shows up twice, once for each computer:
PS> $stats.ComputerSummaries | ft
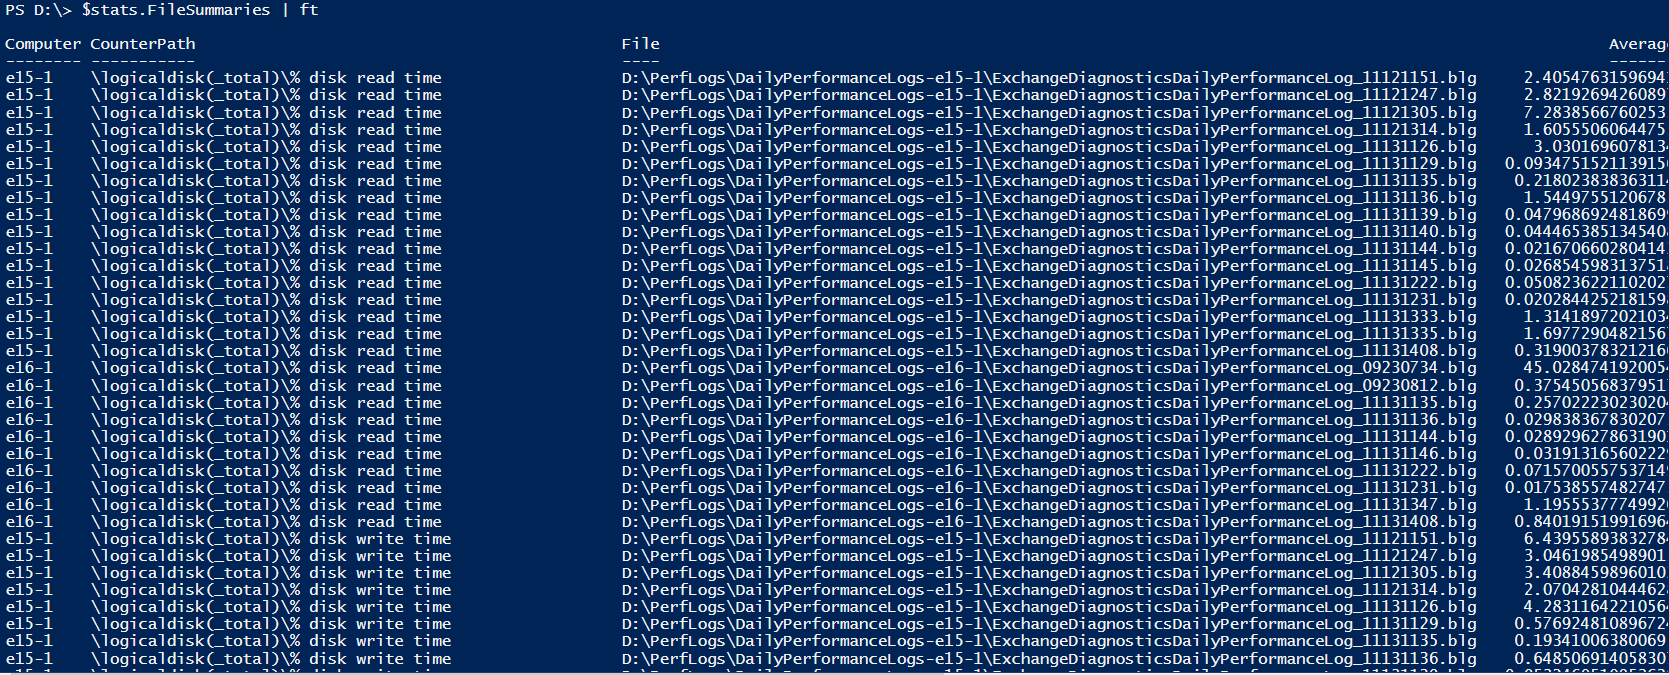
Here’s what the FileSummaries look like. Notice that the same counter shows up many times, corresponding to each time they were found in a file.
PS> $stats.FileSummaries | ft
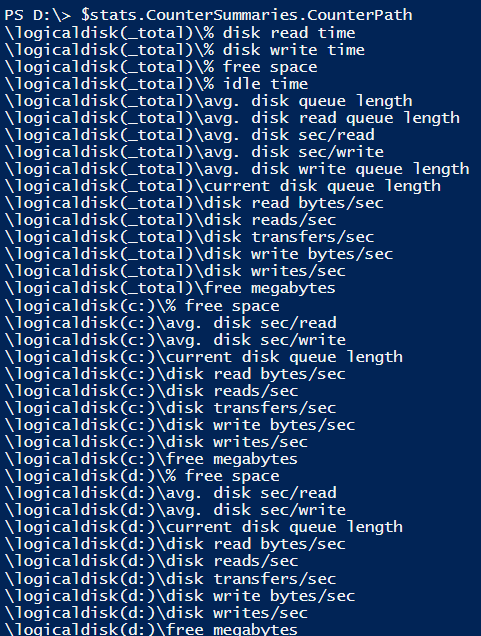
If I want to get a list of the unique counter paths found in the analysis, I can run:
PS> $stats.CounterSummaries.CounterPath
To look at specific counters, I can filter on CounterPath. In this example, I’m going to use wildcards to get Avg. Disk sec/Read and Avg. Disk sec/Write counters for all disks. I’m also sorting by the Maximum value:
PS> $stats.CounterSummaries | Where-Object {$_.CounterPath -like "*avg. disk sec*"} | Sort-Object -Property Maximum -Descending | ft
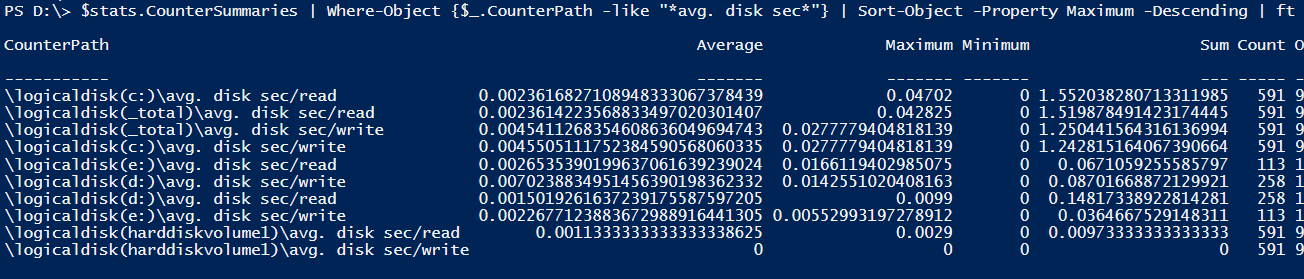
Avg. Disk Sec/Read for the C: drive jumps to the top of the list. Let’s get the files that have that counter, and sort by Maximum:
PS> $stats.FileSummaries | Where-Object {$_.CounterPath -like "\logicaldisk(c:)\avg. disk sec/read"} | Sort-Object -Property Maximum -Descending | ft
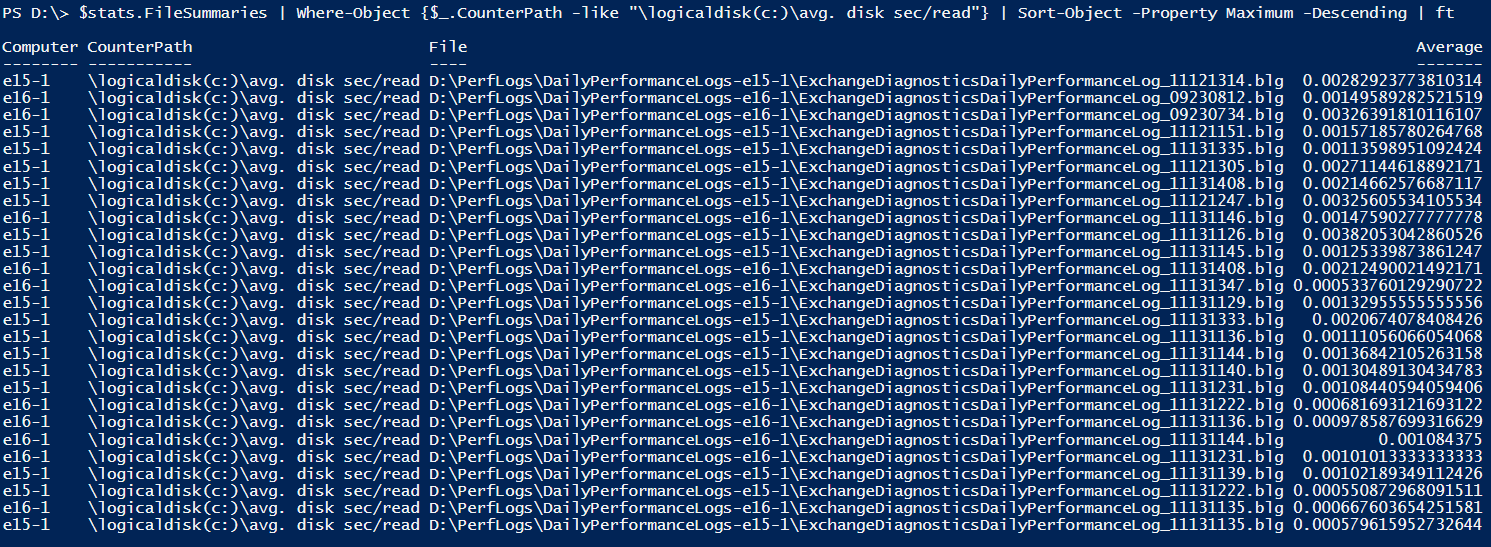
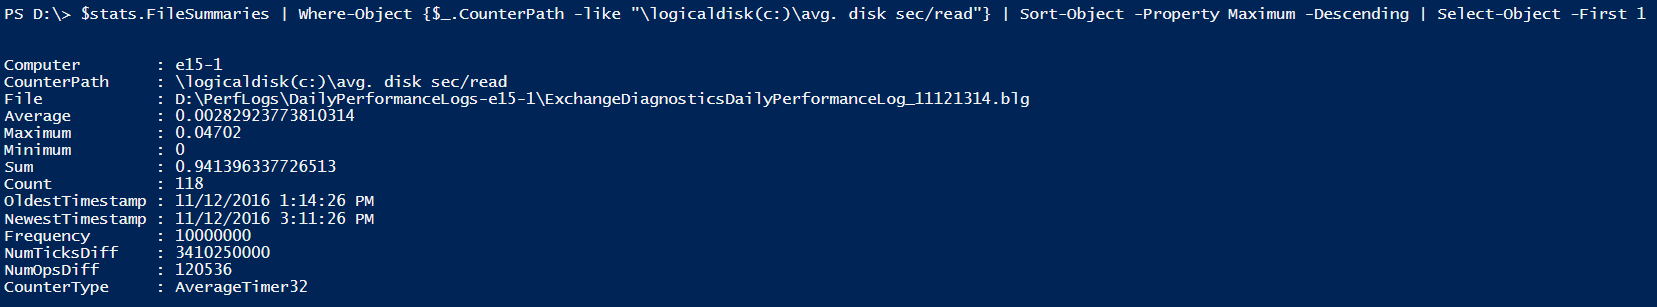
To get just the first file, I can use Select-Object:
PS> $stats.FileSummaries | Where-Object {$_.CounterPath -like "\logicaldisk(c:)\avg. disk sec/read"} | Sort-Object -Property Maximum -Descending | Select-Object -First 1
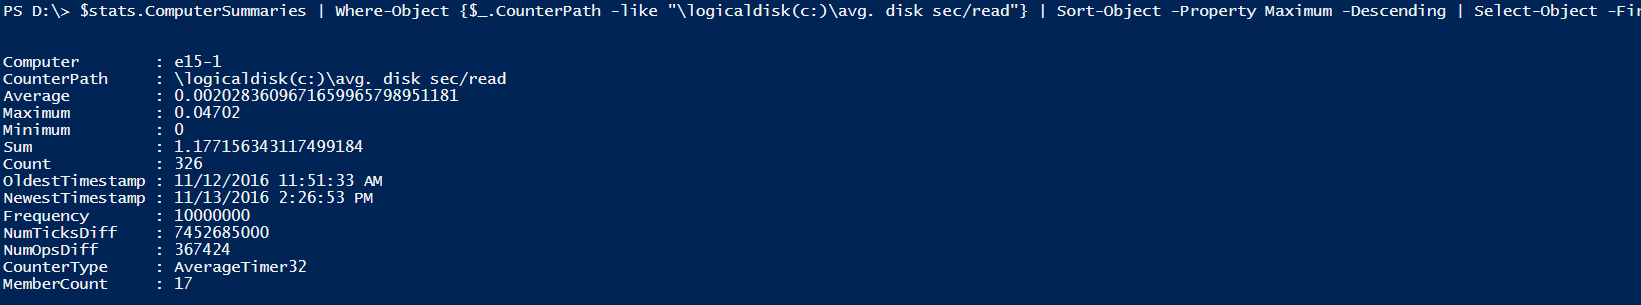
Alternately, if I just wanted to see which computer had the highest value, I can do the same thing in ComputerSummaries:
PS> $stats.ComputerSummaries | Where-Object {$_.CounterPath -like "\logicaldisk(c:)\avg. disk sec/read"} | Sort-Object -Property Maximum -Descending | Select-Object -First 1
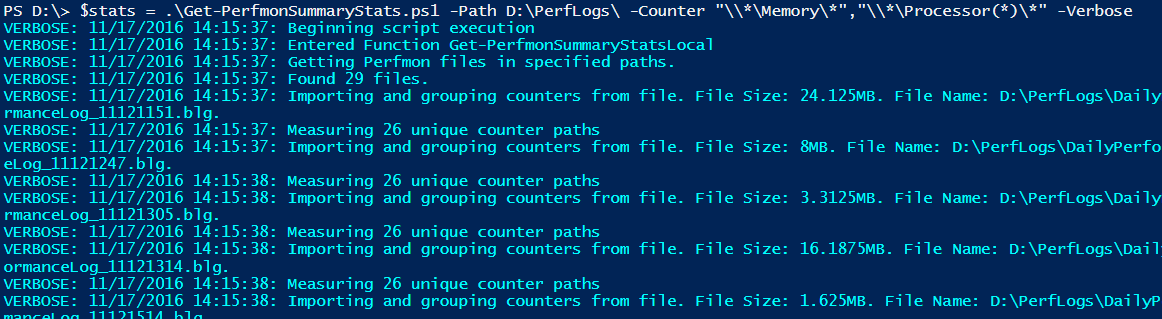
Now I’m going to move onto a new analysis on the same files. This time I’m going to look at all Memory and Processor counters.
PS> $stats = .\Get-PerfmonSummaryStats.ps1 -Path D:\PerfLogs\ -Counter "\\*\Memory\*","\\*\Processor(*)\*" -Verbose
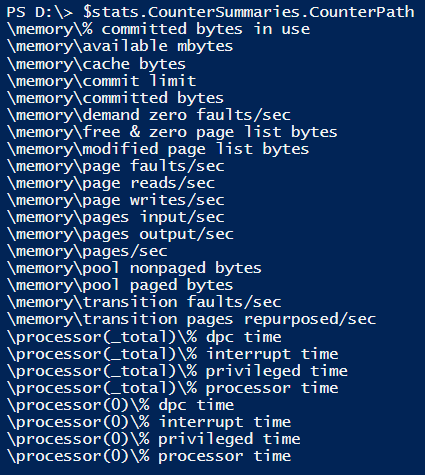
Here’s the counter paths discovered in the new analysis.
PS> $stats.CounterSummaries.CounterPath
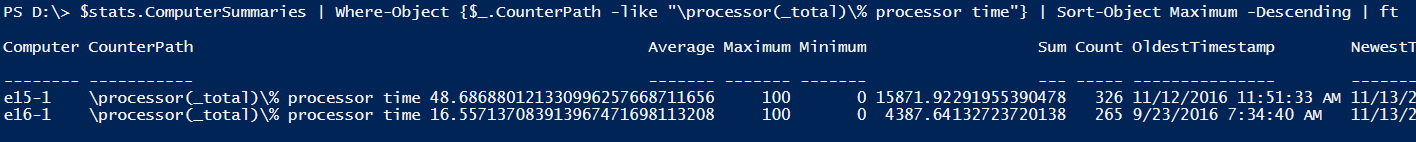
Here’s how to get the total processor time spent on all computers, and sort by Maximum.
PS> $stats.ComputerSummaries | Where-Object {$_.CounterPath -like "\processor(_total)\% processor time"} | Sort-Object Maximum -Descending
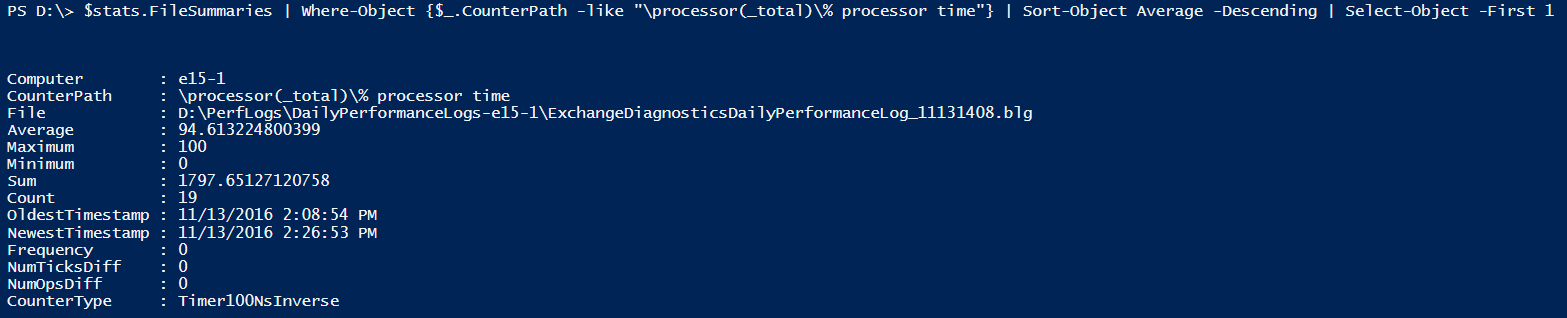
Now I’ll grab the file that contained the highest value.
PS> $stats.FileSummaries | Where-Object {$_.CounterPath -like "\processor(_total)\% processor time"} | Sort-Object Average -Descending | Select-Object -First 1
Conclusion
I’ve found this script to save a lot of time, and make the job a lot easier when working with large amounts of performance monitor files. Hopefully you will find this useful as well.