Microsoft.com Operations Virtualizes MSDN and TechNet on Hyper-V
If you were at MMS 2008 and heard Bob Muglia’s Keynote, you already know that MSDN.microsoft.com (MSDN) and TechNet.microsoft.com (TechNet) have been successfully running on Hyper-V. Specifically, we migrated MSDN March 31 2008, and then followed up with TechNet April 18 2008.
Hyper-V Beta Deployment
Our production testing began in early February 2008, when we installed the Hyper-V role on two physical servers, with each hosting three VMs running MSDN. Production load on these six VMs progressed from a cautious 1 percent to 20 percent very quickly and smoothly. During the next six weeks, we tested various amounts of load and VM combinations to better understand the performance characteristics and scalability of the product and the site. MSDN was also deployed directly onto matching physical servers to compare VMs against physical performance, scale, and stability with the same load characteristics.
In an effort to push the site and Hyper-V to their performance limits, we replayed production IIS logs by using the Web Capacity Analysis Tool (WCAT) to understand the upper range performance and scale characteristics.
We tested and compared one, two, and finally three VMs per physical server. The data gathered is in line with those discussed in the "MSDN and TechNet Virtualization Results" section later in this article. The performance and stability of MSDN on the Hyper-V Beta release were so encouraging that, with RC0 nearing release, we began making preparations to move to the next phase of implementation.
Hyper-V RC0 Deployment
With the release of RC0, we moved forward with the full virtualization of the MSDN front-end Web servers. Testing to date provided the physical and virtualized server capacity targets for peak load and data center redundancy. Although testing indicated two VMs per physical server were optimal for MSDN on these particular physical servers, we maintained the three VM per server architecture. This allowed us to continue evaluating CPU and disk oversubscription.
The deployment is described in Table 1:
| Component | Description |
| Hardware | Dual socket Quad-Core Intel processors 32GB RAM 4x146GB disk drives |
| Virtual Machines | 4 Virtual processors 10GB RAM 250GB dynamic VHD |
Operating system – Parent |
Windows Server 2008 Hyper-V RC0 Reserved 2GB RAM from 32GB total |
Operating system – VMs |
Windows Server 2008 Internet Information Services (IIS) 7.0 |
We placed the first two servers built on Hyper-V RC0 into production to validate that the stability and performance was still in line with that of the beta release. We performed the same load and performance testing for RC0 as we did for the beta deployment while we built out the remaining VMs required for the full deployment.
The VMs in each data center were configured behind a hardware load balancing (HLB) cluster along with the existing physical servers. This allowed us to transfer traffic to the VMs while having the physical servers in place in the event that something unexpected occurred.
Deployment Items of Note
The MSDN VMs were deployed as dynamic virtual hard disks (VHDs), mainly because we were unsure whether we would ultimately deploy two or three VMs on the available physical drive space. Although dynamic disks do not perform quite as well as fixed or physical disk options, this allowed us flexibility at a time when we were deploying VMs manually. In the next stage of our Hyper-V adoption, we plan to implement a storage area network (SAN) infrastructure with the storage resources available to allow testing of all disk options.
We deployed TechNet on the MSDN VMs after our testing proved the VMs were stable and performed well. This is in line with our MSDN and TechNet build and deployment processes, and therefore, dovetails nicely into our future automation goals.
Virtualization Environment for MSDN and TechNet
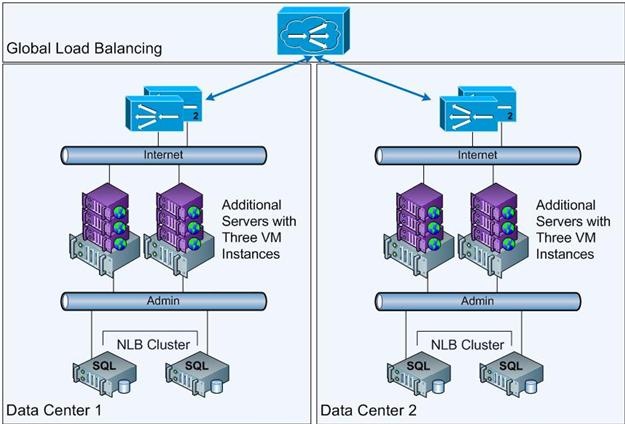
Figure 1 provides a high-level view of the physical and virtual architecture MSDN and TechNet. It illustrates how Hyper-V fits into the MSDN and TechNet architecture, with each physical server hosting three virtual machines with full data center redundancy.
MSDN and TechNet Virtualization Results
The results of our implementation MSDN and TechNet on Hyper-V RC0 are summarized in the following sections: Stability, Performance, and Lessons Learned.
Stability
- Hyper-V has been exceptionally stable, proving capable of delivering the end-to-end availability of MSDN and TechNet compared to the previous physical platform during both beta and RC0 usage. In fact, for the deployment so far, MSCOM Ops has not encountered a single production-impacting bug. This is definitely quite an accomplishment for the Hyper-V development team.
- Log Parser analysis of the IIS logs showed that the error rates were comparable between the virtual and physical instances.
Performance
- Hyper-V CPU overhead (as measured by the parent partition utilization) was 5 to 6 percent with linear progression as the number of requests increased. This is illustrated in Figure 2.
- CPU oversubscription (three four-processor VMs on an eight-processor physical server) resulted in 3 percent lower overall performance per physical server based on overall requests per second per 1 percent CPU.
- Requests per second per 1 percent CPU performance of MSDN over the previous physical server platform improved. This demonstrates to us the viability of efficient consolidation from dedicated older physical servers to shared virtualized platforms.
- Physical MSDN handled 21 percent more requests per second per 1 percent CPU than virtualized MSDN. Figure 3 illustrates physical compared to virtual scale up for MSDN under peak production load on matching hardware.
Note: Requests per 1 percent CPU was a primary performance benchmark for our MSDN deployment because it distilled Hyper-V's effects down to a simple, but meaningful, number for these Web sites.
Figure 2 illustrates a detailed breakout of virtual machine, Hyper-V, and guest CPU utilization.
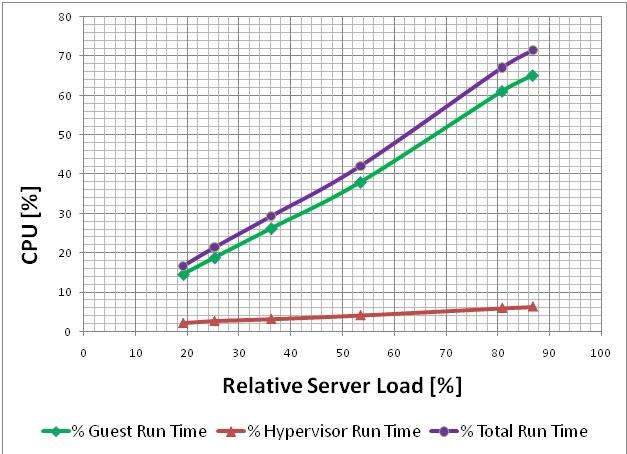
Figure 2. 5-6% CPU Hyper-V Cost on Physical Blade with Reasonably Linear Progression as Number of Requests Increase
Figure 3 illustrates how we used two blade servers to compare high utilization physical to virtual scalability. Lower CPU utilization is better.
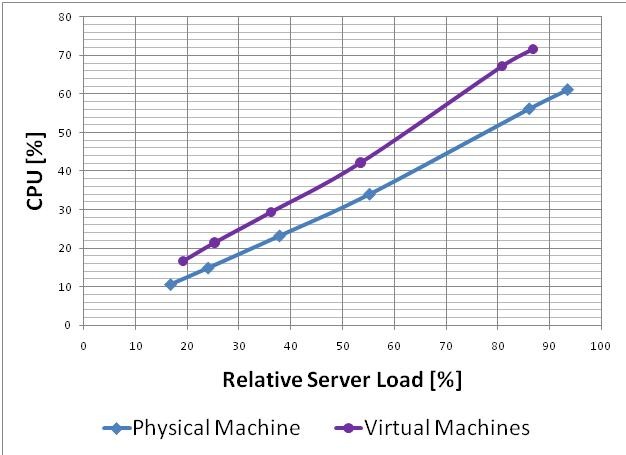
Figure 3. Reasonably Linear CPU Utilization Progression Using MSDN Production Load
Lessons Learned
- Based on our results with Hyper-V, and a review of current hardware utilization across our environment, we expect to realize significant benefits by consolidating diverse applications on a virtualized platform. Mixing high and low scale systems on the same physical server resources should enable us achieve improved overall hardware utilization and a reduced physical footprint.
- Although we reduced our hardware supporting MSDN and TechNet by migrating from older physical servers to a smaller deployment of new, more powerful physical servers, there is some minimal overhead associated with virtualization. From our perspective, Hyper-V has clearly delivered enough performance, stability, and scale to drive widespread adoption in our production environment. The flexibility and management gains expected from coupling System Center Virtual Machine Manager (SCVMM) v2 with Hyper-V should justify the measured overhead.
- If the three percent or less in additional overhead from oversubscribing resources is consistent with additional application workloads tested, oversubscription with Hyper-V should provide MSCOM Ops significant flexibility and reasonable performance for application consolidation.
- The results we achieved are based on the application characteristics of MSDN and TechNet on Hyper-V RC0. We are working to build a model based on this data that we hope will allow us to predict physical and VM requirements based on common performance characteristics of a Web site. The model will likely include the current requests per second per 1 percent CPU metric with additional memory and I/O performance characteristics as we virtualize other Web applications and gather more test and production data.