Windows Enterprise Client Boot and Logon Optimization – Part 17, Wait Analysis – More Challenging Example
This post continues the series that started here.
In my last post I introduced Wait Analysis, showing a simple example. In this post, I’ll describe the process of following waits from one thread to another.
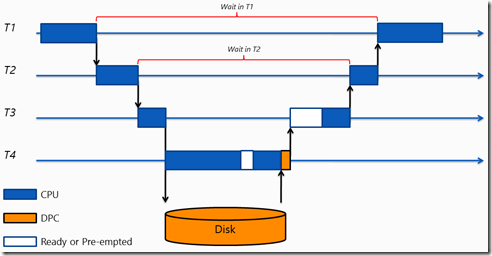
Referring to the diagram from last time –
I’d start by finding thread T1 waiting, identify that it’s waiting for thread T2, identify that thread T2 is waiting on thread T3 and so on.
Wait Analysis Example
In this example, users were experiencing slow logons to a Remote Desktop Server during the Winlogon phase.
As I did in the last post, I open the trace in Windows Performance Analyzer (WPA) , select and zoom to the time of interest* and then examine the Generic Events table.
* Being a Remote Desktop Server, this scenario is actually a little more difficult to analyse because you can’t conduct a full boot trace and you don’t see boot phases using the FullBoot.Boot.Regions definition. Instead, we choose Performance Scenario General in Windows Performance Recorder and then use the FastStartup.Regions definition. We can observe individual Winlogon phases for each user.
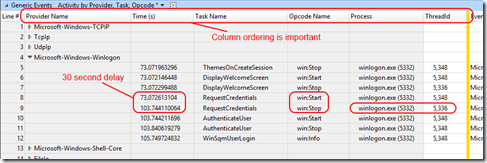
Here I see a wait of around 30 seconds during RequestCredentials. This aligns with winlogon.exe (5332), ThreadID 5336.
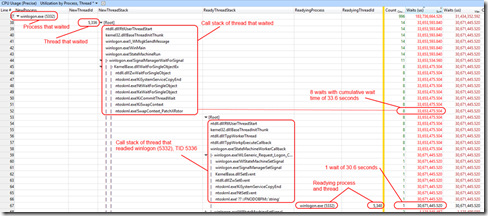
As I did in my last post, I now examine this process and thread using the CPU Usage (Precise) table, order columns and expand the thread stack –
After ordering by the Waits (us) sum column, I see that most of the time thread 5336 waited took place in 8 separate events but the longest wait was around 30.6 seconds.
Furthermore, I see that winlogon.exe (5332), ThreadID 5336 waited on winlogon.exe (5332), ThreadID 5348. This new process/thread is where I want to look next. Repeating the same steps in the CPU Usage (Precise) table shows –
Note that because the thread stack is very deep, I’m saving space by trimming it in the graphic which is what the green area represents.
Now I see that winlogon.exe (5332), ThreadID 5348 waited 30.6s for LogonUI.exe (5384), ThreadID 5472 and again, this was a single wait … I’m heading in the right direction.
Again, I repeat the investigation, examining LogonUI.exe (5384), ThreadID 5472. This wait chain goes on for a few more threads. To save you from repetition, what I observe is –
LogonUI.exe (5384), thread 5472 waits on LogonUI.exe (5384), thread 5388
LogonUI.exe (5384), thread 5388 waits on LogonUI.exe (5384), thread 5464
Finally, examining LogonUI.exe (5384), thread 5464 yields a clue –
CtxWinlogonProv.dll is a Citrix binary and after some research, a Citrix support article was found –
CTX133873 - Slow Logons in XenApp Sites with Read-Only Domain Controllers
A Word of Warning
Wait Analysis won’t always yield obvious results. Sometimes, instead of a single event with a long wait, you’ll have thousands of events all with tiny waits. Understanding why that same wait is occurring over and over again may not be clear.
Look for clues in the function names you see in the call stacks and look for third party modules that may explain your issues.
If you get this far and you’re still searching for answers, my suggestion would be that you log a support case with Microsoft. Use the keyword SBSL and it should be directed to the right team for investigation.
Conclusion
Parts 5 to Part 17 of this post series have covered the troubleshooting approach you might take for boot and logon performance issues that creep into production.
I’ve discussed boot phases, the activities that occur during and across those phases, the potential issues in each phase and the troubleshooting tools you can use to help identify those issues.
Next Up


