Windows Enterprise Client Boot and Logon Optimization – Part 9, CPU and Disk Utilization
This post continues the series that started here.
In Part 6 of this series, I proposed a boot and logon troubleshooting approach as –
- Gather a boot trace and examine the boot phases. Systematically investigate the most time consuming phasesa
- Review disk utilization during the delayed phase. Disk I/O is a common bottleneck. Identify processes that are high contributors
- Review CPU utilization during the delayed phase. Identify processes that are high contributorsb
- Examine the behaviour of activities that occupy and span the lengthy phase
- Failing all else, proceed to wait analysisc
a. Investigate one phase at a time
b. Multi-processor systems may not obviously reflect CPU consumption.
Keep in mind that consumption of a single core on an 8 processor system
= 100 / 8
= 12.5% processor consumptionc. A detailed discussion of Wait Analysis will appear in a later post
Before I discuss each individual boot phase, I want to cover the examination of CPU and Disk Utilization with Windows Performance Analyzer (WPA).
Loading Symbols
Symbols contain information about the programming-language constructs that generated specific machine code in a module. WPA is able to use symbols and expose the names of functions in certain events captured during an analysis trace.
In order to use symbols, WPA must be configured to download them. I find that setting a pair of environment variables from an elevated command prompt to be the best approach. Doing so means I only have to do it once for my analysis system -
setx /M _NT_SYMBOL_PATH SRV*C:\Symbols*https://msdl.microsoft.com/download/symbols
setx /M _NT_SYMCACHE_PATH C:\SymCache
The first of these commands sets the symbol path environment variable to a local path of C:\Symbols and downloads symbols from Microsoft. The second command specifies the symcache path as C:\SymCache. WPA uses this as a kind of “scratch pad” to process symbol information.
With these environment variables set, you can open your analysis trace and at any time, select Load Symbols from the Trace menu -
Depending on the speed of your Internet connection, loading symbols may take some time -
Keep in mind that only symbols for Microsoft binaries will become available using the instructions I’ve provided here. Third-parties may not make symbols available. You’d need to ask the vendor to see if they have a public symbol repository.
The last thing to mention about symbols is that after collecting an analysis trace, you may find an NGENPDB folder in the same location as the trace. This folder contains symbols for .Net components which have been automatically generated during trace capture. If you are copying the analysis trace to another computer, you should also copy the NGENPDB folder.
CPU Utilization
As I’ve mentioned above, investigation of a slow boot phase is done by selecting and zooming to that phase (more on this in future posts), after which you’ll want to start investigation with CPU and Disk Utilization.
I find it best to examine CPU Utilization by adding two instances of Computation –> CPU Usage (Sampled) to the analysis view.
The data in the CPU Usage (Sampled) graph/table is collected by sampling CPU activity every 10ms. For this reason, it’s ideal for investigation of high CPU issues.
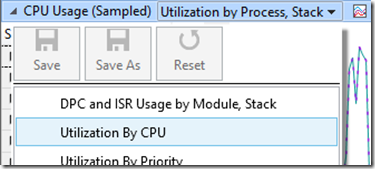
I configure the first graph instance to display only the graph and from the menu at the top left corner, I select Utilization by CPU -
I configure the second graph instance to display only the table.
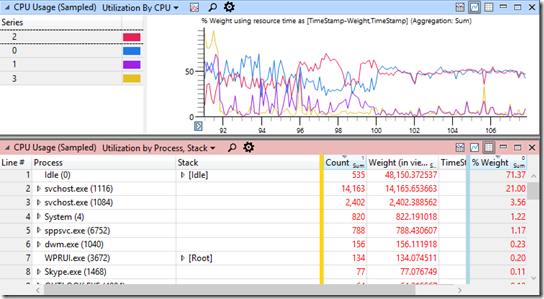
By making these choices, the graph shows me a view of total CPU utilization and the table displays the processes that are the greatest CPU contributors (ordered top to bottom) -
Here, svchost.exe (1116) is the greatest contributor to the overall CPU utilization displayed in the graph.
Analysis to this point may be enough to choose your next action. The top contributor to CPU utilization may be a process you can remove or launch as a delayed scheduled task. I often see instant messaging clients or mail clients automatically launched at logon which steal CPU time away from other, more important activities.
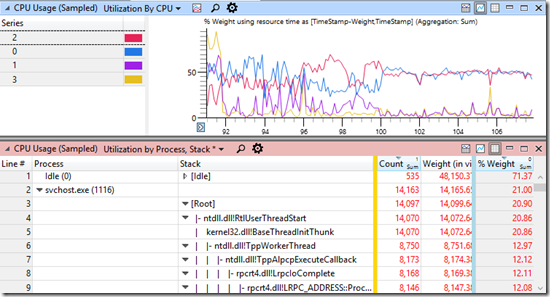
Sometimes, you won’t be sure how to proceed. By loading symbols as I’ve discussed above, you can expose the code path (stack of binaries and functions) spending most time on the CPU within a process -
The information in the stack column appears as module!function. My reviewing the names of functions, you may be able to deduce process behaviour at the time of high CPU consumption.
Ultimately, you may need the assistance of a Microsoft support engineer that has code access (if the issue is in a Microsoft process) or a third-party support engineer if the issue is in non-Microsoft code. This approach I’m suggesting just gives you a deeper view of system activity that may empower you to take action.
Disk Utilization
Reviewing disk activity is quite similar to CPU Utilization. I start by adding two instances of Storage –> Disk Usage Utilization by Disk.
I configure the first instance to display only the graph.
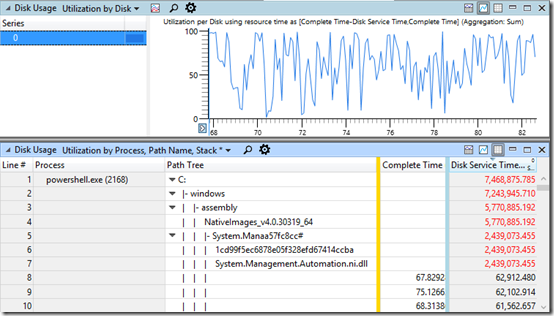
The second instance I display as a table, change the view to Disk Usage Utilization by Process, Path Name, Stack and then change the columns so that they display as Process, Path Tree, <golden bar> .
The resulting view looks like this -
The graph at the top gives me great insight into how busy the disk is overall while the table shows me the processes responsible for the I/O. Expanding rows in the Path Tree column show me exactly which files on disk are being accessed and from that, I can begin to deduce my next course of action.
Conclusion
Today I’ve discussed my preferred approach to examining CPU and Disk Utilization with Windows Performance Analyzer. These techniques provide evidence and clues regarding cause for high CPU and Disk consumption.
Sometimes these investigations won’t lead to a clear next step. If the system has poor physical hardware, it may be the case that you just can’t improve performance. On the other hand, fast systems behaving poorly may reveal insightful results.
Next Up


