Windows Enterprise Client Boot and Logon Optimization – Part 6, Boot and Logon Overview
This post continues the series that started here.
Before I discuss boot and logon analysis in any detail, it’s important to provide an overview so that you clearly understand the troubleshooting approach.
The boot and logon of Windows includes a number of distinct phases. When a particular phase is slow, the investigation of delays requires an understanding of –
- Activities within each phase
- Activities that cross phase-boundaries
Windows Performance Analyzer (WPA) (see Part 5) as well as analysis summaries you can generate with XPerf.exe, (see Part 3 and Part 4) expose these activities for examination. Consider -
In more detail, the troubleshooting approach is –
- Gather a boot trace and examine the boot phases. Systematically investigate the most time consuming phasesa
- Review disk utilization during the delayed phase. Disk I/O is a common bottleneck. Identify processes that are high contributors
- Review CPU utilization during the delayed phase. Identify processes that are high contributorsb
- Examine the behaviour of activities that occupy and span the lengthy phase
- Failing all else, proceed to wait analysisc
a. Investigate one phase at a time
b. Multi-processor systems may not obviously reflect CPU consumption.
Keep in mind that consumption of a single core on an 8 processor system
= 100 / 8
= 12.5% processor consumptionc. A detailed discussion of Wait Analysis will appear in a later post
The very early phases of boot will not be included in the trace. During POST and OSLoader, Event Tracing for Windows (ETW) hasn’t started yet -
A Note on Trace Capture
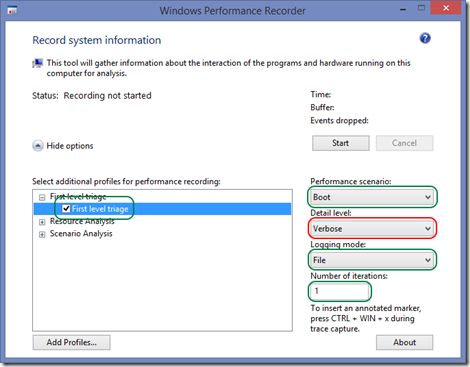
For most of the analysis I’ll be discussing, a timing trace (discussed in Part 3) includes sufficient detail. Some of the analysis however, will require a greater level of detail. For this reason, I recommend the collection of an analysis trace any time you want to investigate boot and logon delays – it just saves you having to do it twice.
An analysis trace uses the same options as a timing trace (shown below in green) except for the detail level (shown below in red)
Conclusion
I’ve discussed the foundational information you need to begin boot and logon analysis. In posts to come, I’ll discuss analysis of cross-phase activities as well as each boot phase in turn.
For each boot phase, I’ll discuss the activities that occur within the phase, measurement of the phase and potential problems.
Next Up


