Map Dashboard in SC 2012 Operations Manager
Today, I will show you how you can create a map dashboard that displays availability and monitoring data for configured Web Application Availability tests. I will walk you through the bare minimum steps needed to display a map dashboard with some useful data.
Prerequisites
To complete this tutorial, you will need the following:
- A System Center 2012 Operations Manager management group with at least 1 agent and 1 management server.
- A machine with the Operations Console installed.
- 15-25 minutes of available time
Locations
All monitoring workflows that are run by Operations Manager are hosted by either an Agent or a Management Server. SC 2012 Operations Manager allows you to associate a location with the following:
- One or more agents
- One or more management servers
- One or more resource pools
This is accomplished through PowerShell. Let’s open the Operations Manager Shell:
SCOM 2012 ships with several cmdlets to manage locations:
| Cmdlet Name | Description |
| Get-SCOMLocation | This cmdlet can be used to list all the locations configured in a management group. It can also be used to obtain a location of a particular agent, management server, resource pool, or a managed entity. |
| New-SCOMLocation | This cmdlet creates a new location with the specified display name, longitude and latitude. |
| This cmdlet removes an association between a location and a set of agents, management servers, or resource pools. It can also be used to remove the location from the management group. | |
| Set-SCOMLocation | This cmdlet associates an existing location with a set of agents, management servers, or resource pools in the management group. |
| Update-SCOMLocation | This cmdlet updates the specified location with a new display name, longitude, or latitude. |
Create New Locations
The environment I’m using to write this article consists of a management server and an agent. I will associate them with the following locations:
| Display Name | Latitude | Longitude |
| Redmond, WA | 47.6739882 | -122.121512 |
| Chicago, IL | 41.850033 | -87.6500523 |
To create the above locations, execute the following script in the shell:
PS C:\> New-SCOMLocation -DisplayName "Redmond, WA" -Latitude 47.6739882 -Longitude -122.121512
PS C:\> New-SCOMLocation -DisplayName "Chicago, IL" -Latitude 41.850033 -Longitude -87.6500523
To verify that the locations have been created successfully, execute the following:
PS C:\> Get-SCOMLocation
Your output should be similar to the following:
PS C:\> Get-SCOMLocation
Name : 6775251e-c851-4a6f-b6ab-90faeb87d9a1
Path :
DisplayName : Redmond, WA
FullName : System.GeoLocation:6775251e-c851-4a6f-b6ab-90faeb87d9a1
ManagementPackClassIds : {a7f774ed-534c-08af-2fbf-54cbe1745388}
LeastDerivedNonAbstractManagementPackClassId : a7f774ed-534c-08af-2fbf-54cbe1745388
TimeAdded : 5/21/2012 7:28:07 PM
LastModifiedBy : 7431e155-3d9e-4724-895e-c03ba951a352
Values : {6775251e-c851-4a6f-b6ab-90faeb87d9a1, 47.6739882, -122.121512, System.C
onfigItem.ObjectStatusEnum.Active...}
LastModified : 5/21/2012 7:28:08 PM
IsNew : False
HasChanges : False
Id : 28409a53-d0c0-c163-2f4c-3d16b76de26c
ManagementGroup : marcin-mg
ManagementGroupId : 8f2d17ec-fe46-dded-0534-cdc8ad551e67
Name : 314f1262-063a-4435-a479-d12b0387499b
Path :
DisplayName : Chicago, IL
FullName : System.GeoLocation:314f1262-063a-4435-a479-d12b0387499b
ManagementPackClassIds : {a7f774ed-534c-08af-2fbf-54cbe1745388}
LeastDerivedNonAbstractManagementPackClassId : a7f774ed-534c-08af-2fbf-54cbe1745388
TimeAdded : 5/21/2012 7:28:58 PM
LastModifiedBy : 7431e155-3d9e-4724-895e-c03ba951a352
Values : {314f1262-063a-4435-a479-d12b0387499b, 41.850033, -87.6500523, System.Co
nfigItem.ObjectStatusEnum.Active...}
LastModified : 5/21/2012 7:28:58 PM
IsNew : False
HasChanges : False
Id : 81e88875-f33e-c518-363d-5cdbf345c55c
ManagementGroup : marcin-mg
ManagementGroupId : 8f2d17ec-fe46-dded-0534-cdc8ad551e67
Associate Locations
Now that we have locations in our management group, let’s associate one of them with a management server and another with an agent. Execute the following in the shell:
PS C:\> $redmond = Get-SCOMLocation -DisplayName "Redmond, WA"
PS C:\> $chicago = Get-SCOMLocation -DisplayName "Chicago, IL"
Verify that $redmond variable is assigned by executing the following (your output should look similar):
PS C:\> $redmond
Name : 6775251e-c851-4a6f-b6ab-90faeb87d9a1
Path :
DisplayName : Redmond, WA
FullName : System.GeoLocation:6775251e-c851-4a6f-b6ab-90faeb87d9a1
ManagementPackClassIds : {a7f774ed-534c-08af-2fbf-54cbe1745388}
LeastDerivedNonAbstractManagementPackClassId : a7f774ed-534c-08af-2fbf-54cbe1745388
TimeAdded : 5/21/2012 7:28:07 PM
LastModifiedBy : 7431e155-3d9e-4724-895e-c03ba951a352
Values : {6775251e-c851-4a6f-b6ab-90faeb87d9a1, 47.6739882, -122.121512, System.C
onfigItem.ObjectStatusEnum.Active...}
LastModified : 5/21/2012 7:28:08 PM
IsNew : False
HasChanges : False
Id : 28409a53-d0c0-c163-2f4c-3d16b76de26c
ManagementGroup : marcin-mg
ManagementGroupId : 8f2d17ec-fe46-dded-0534-cdc8ad551e67
Do the same for the $chicago variable.
Now, use the Get-SCOMAgent cmdlet to find an agent in your management group. Assign the agent to the $agent variable. Then, use the Get-SCOMManagementServer cmdlet to find a management server in your management group and assign the server to the $server variable. (These steps are specific to your own environment. I can’t provide you instructions that will work there.)
Verify that the $server and $agent variables are assigned.
Execute the following in the shell:
PS C:\> Set-SCOMLocation -Agent $agent -Location $chicago
PS C:\> Set-SCOMLocation -ManagementServer $server -Location $redmond
The locations should be associated correctly now. You can verify that by executing the following in the shell:
PS C:\> Get-SCOMLocation -ManagementServer $server
PS C:\> Get-SCOMLocation -Agent $agent
The output of either command should be a location object.
Web Application Availability Monitoring
By now, we have created the locations and associated them with a management server and an agent. Now we need to configure Web Application Availability monitoring.
Configure the monitoring
Let’s open the Operations Console and switch to the Authoring pane. Expand the Management Pack Templates tree and click on Web Application Availability Monitoring. Right-click on it and click Add Monitoring Wizard… .
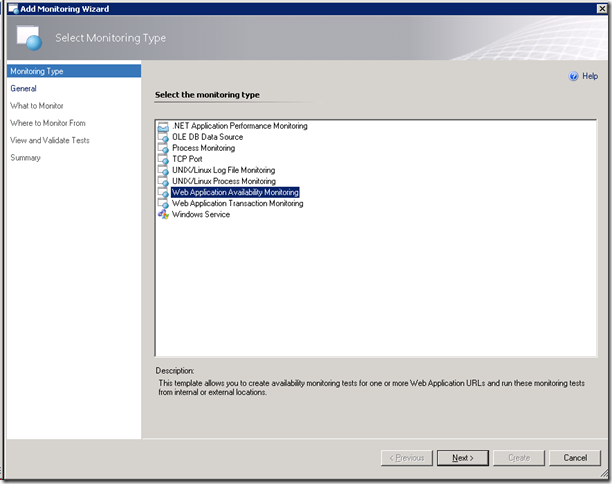
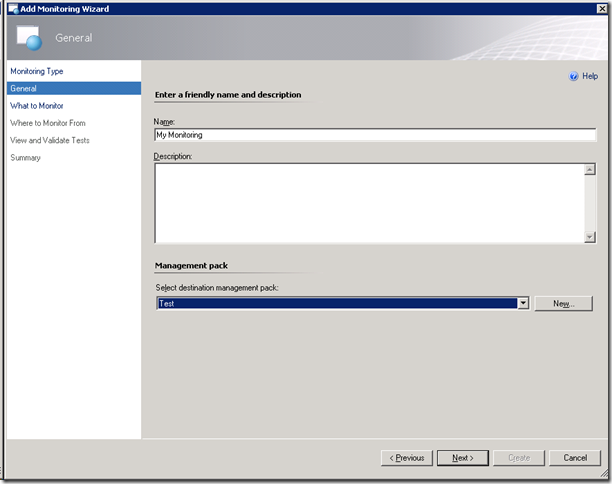
Make sure that Web Application Availability Monitoring is selected and click Next. On the next page, please enter a name for the template (I will use “My Monitoring”) and select an MP where the template will live.
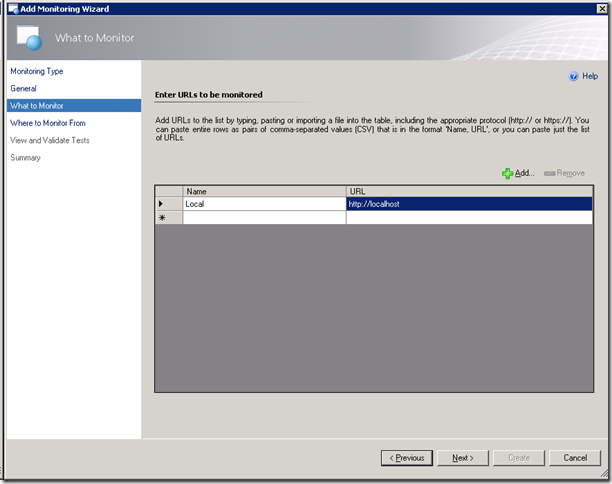
Click Next when done. On the next page, please enter a name and a URL to monitor. I will use https://localhost, but feel free to use any internal or external URL.
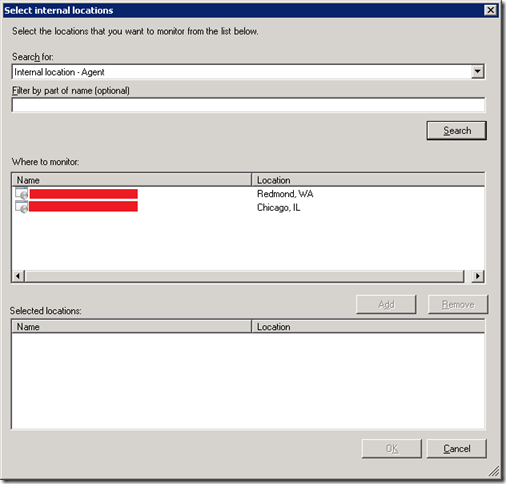
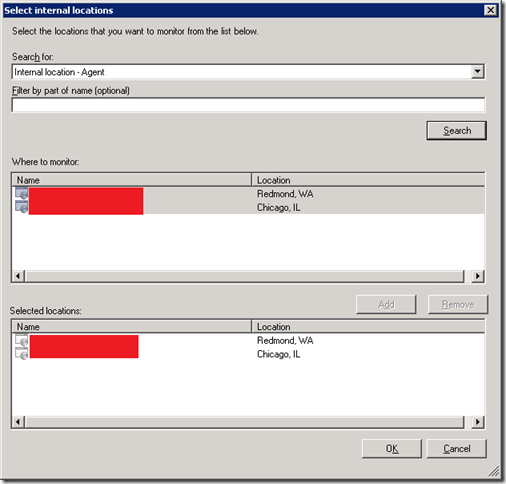
Click Next when done. On the next page, click the Add… button to add a location from where you want the URL to be monitored. In the dialog that appears ensure that the Search for field is set to Internal location – Agent and click Search. Several locations will appear in the list:
Select two items that match the agent and server from the previous steps in this tutorial (specific to your environment). Once the two items are selected, click Add:
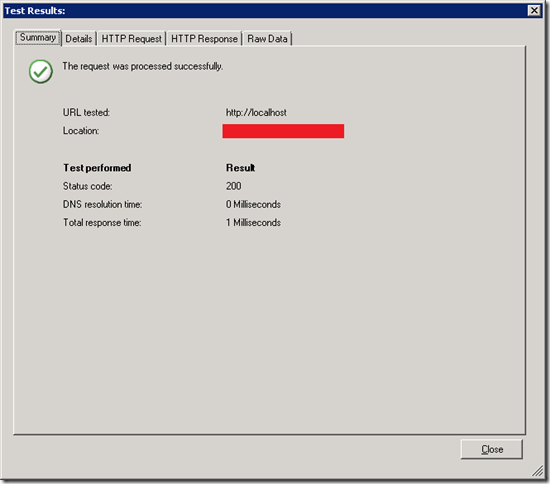
Click OK and then Next. On the next page, click Run Test to verify that the tests will work.
Click Close and then Next. Verify that everything is correct at the Summary page and click Create. You should see the new template in the Web Application Availability Monitoring folder:
View the Map Dashboard
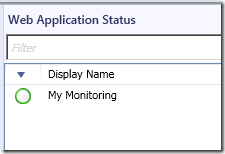
Now that our monitoring is configured, let’s take a look at the map dashboard. In the Operations Console switch to the Monitoring pane and navigate to Application Monitoring \ Web Application Availability Monitoring folder and expand it. Click the Web Application Status dashboard in the folder. You may see something like this:
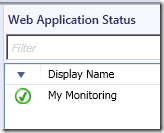
It may take some time for the monitoring to become active. Please wait until the dashboard looks like this:
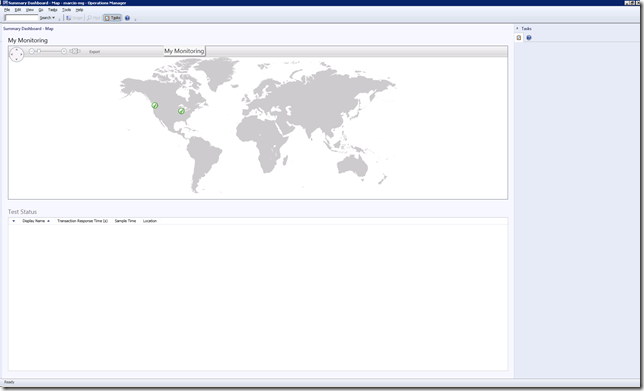
Select My Monitoring and click the Summary Dashboard – Map link in the Tasks pane. This will open a new window that should be similar to this:
This dashboard is showing the locations from which Web Availability Monitoring tests are running from. If you recall from previous steps, we configured the tests to run from an agent and server that had geographic locations associated with them. This information is used to populate this dashboard.
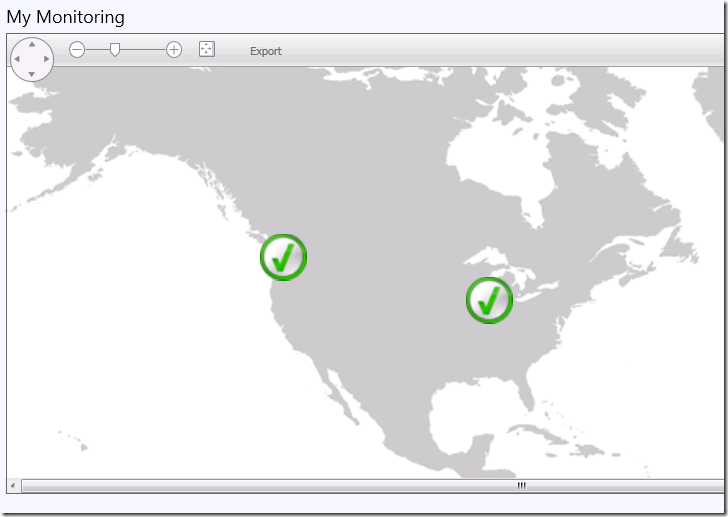
If you zoom in a bit, you’ll see that the green checkmarks are located by Redmond, WA and Chicago, IL:
If you select one or more locations in the map (use Ctrl select to select multiple or deselect items), the Test Status portion of the dashboard will light up. Select the Chicago location:
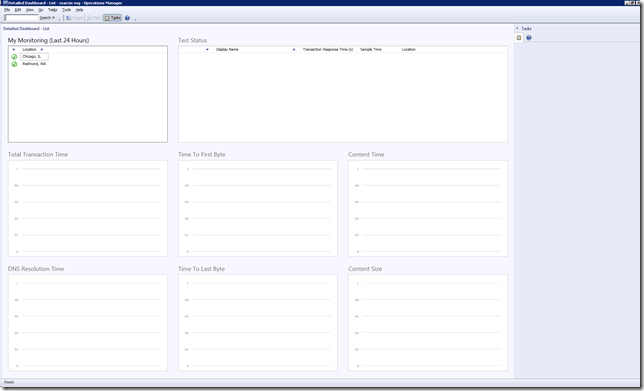
Select the item in the Test Status table and click the Detailed Dashboard – List link in the Tasks pane. This will bring up a dashboard that displays performance data collected from Web Application Availability tests:
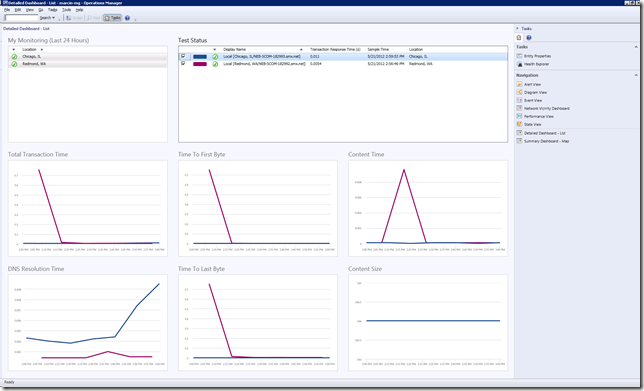
Select one or more locations and put a check mark by at least one of the items under Test Status. You should see something like this:
It may take some time for the data to appear in the dashboard.
Congratulations! You now know how to associate locations with agents and/or servers and how to display that information using the Summary Map Dashboard.

