Tip: Kernel Debugging a VPC Server
Here is little tip for you that want to practice kernel mode debugging but either don’t have 2 machine machines to play the TARGET and HOST roles or simply don’t want to play with (for any reason) with the old null modem serial cable used to connect the HOST to the TARGET: It’s possible to use a Virtual PC machine to play the TARGET role, so all you would need is the Virtual PC image correctly configured to boot up in DEBUG mode (through the regular boot.ini options - /DEBUG /DEBUGPORT=COM# /BAUDRATE=115200) and map its serial COM port to a named pipe.
How to do so:
Supposing you already have a Virtual PC image set up (it can be an image of Windows 2000, Windows XP or Windows 2003), you just need to follow the step by step list below:
1. Login as admin in the VPC image and edit the c:\boot.ini file to include a new boot up OS option as following:
A default boot.ini file will likely have the following content:
[boot loader] timeout=3 default=multi(0)disk(0)rdisk(0)partition(1)\WINDOWS [operating systems] multi(0)disk(0)rdisk(0)partition(1)\WINDOWS="Microsoft Windows XP Professional" /fastdetect |
Edit the boot.ini and add the highlighted line below:
[boot loader] timeout=3 default=multi(0)disk(0)rdisk(0)partition(1)\WINDOWS [operating systems] multi(0)disk(0)rdisk(0)partition(1)\WINDOWS="Microsoft Windows XP Professional" /fastdetect multi(0)disk(0)rdisk(0)partition(1)\WINDOWS="Microsoft Windows XP Professional – DEBUG" /fastdetect / DEBUG /DEBUGPORT=COM1 /BAUDRATE=115200 |
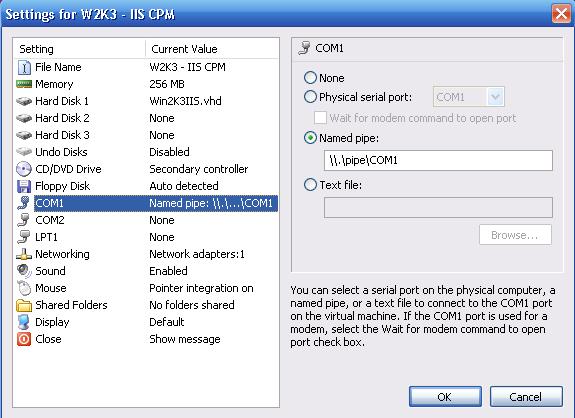
2. Before rebooting the VPC image, go the VPC console, select the option “Settings” under the menu “Edit”. Find the configuration item for the COM1 port, select the radio button “Named Pipe” and type the string \\.\pipe\COM1 as the picture below illustrates.
This VPC image (the virtual machine) will be the TARGET system, or the machine whose the kernel will be debugged. Your real machine (the one hosting the VPC image) will be the HOST machine or the one which will run the debugger that will be attached to the TARGET’s system kernel.
3. Start a Windbg (from the Debugging Tools For Windows) instance with the following command line options:
windbg -k com:pipe,port=\\.\pipe\COM1,resets=0,reconnect |
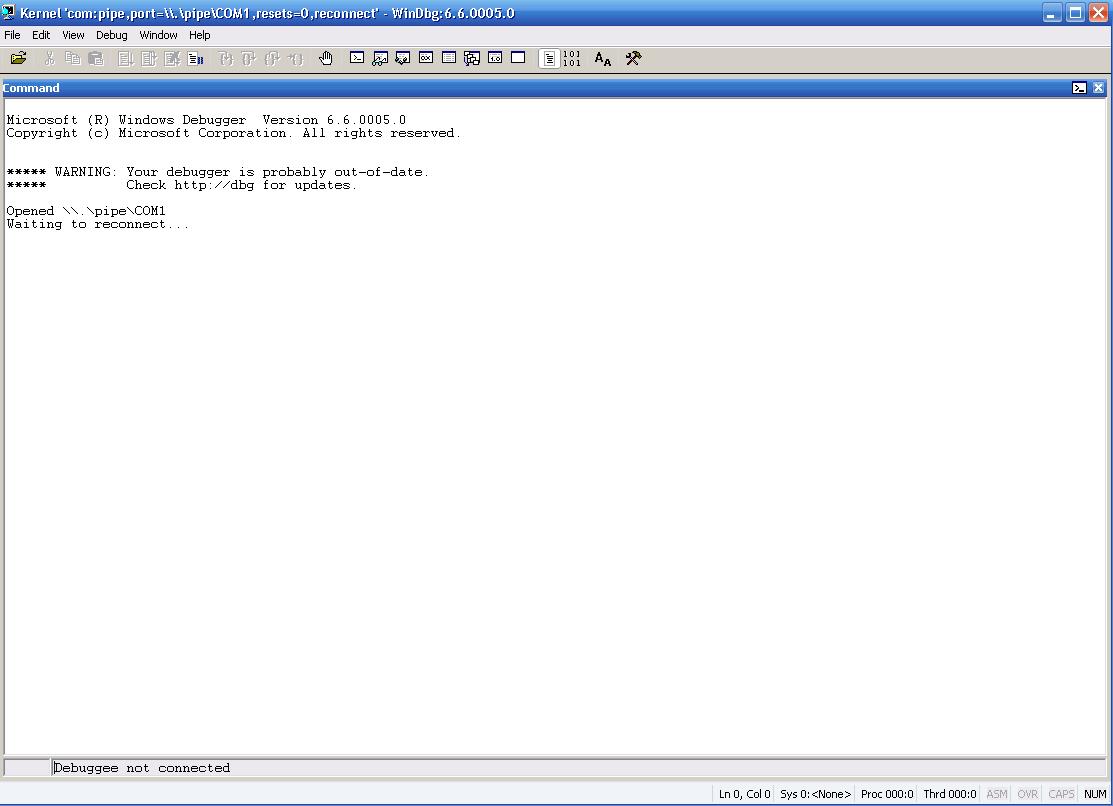
The Windbg will open up it’s command window and will wait to connect through the named pipe mapped port as soon as VPC OS starts up. The picture below illustrates how the Windbg will start up with these command line parameters:
4. Now reboot the VPC image and select the new option you’ve included in the boot.ini in the step 1 of this procedure. During the boot process, as soon as the kernel gets loaded the Windbg will attach to it. All you need to do now if break the debugger at the point you want to start debugging and have fun J.

