Planning for Desktop Virtualization with the MAP toolkit 7.0 (4 of 4)
Whew! Just got back into town from southern Ohio where it was smoking hot! I couldn’t help but yearn for a bit of the cool NW summer weather. Now, that I’m back, I wanted to jump right back into the saddle with another hot topic – how do I figure out what apps are installed on what machines and which users are using those machines!!!
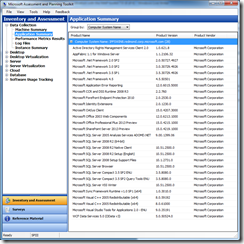
Since the earliest days of MAP, the toolkit has provided a list of installed applications discovered during a MAP inventory. Later, the toolkit started to provide a view in the UI of the applications installed on each machine in the Application Summary view under Data Collection.
One of the BIGGEST requests that we’ve had over the years was to provide a report where you could get this view of the data. Well – in MAP 7.0, we’ve moved you one step closer by providing this information through a database view and Microsoft Excel. The name of the view is InstalledProducts_view.
This view contains several key pieces of information that you can use to do a number of things including:
- Understand what applications and versions are installed throughout your organization
- See the Operating Systems on which these apps are running and whether the machine is physical or virtual
- See who is using the machines on which the apps are running
- Get important license related information such as processor counts, total cores and logical processor counts
To get started, you will need to open Excel and connect to your local SQL Server database that is storing the MAP data that you want to view. There are two different ways to connect, depending on the version of SQL Server that you are using.
Using your own SQL Server instance
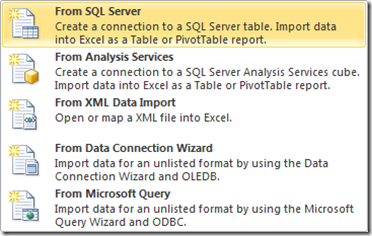
If you are using your own instance (the non-default MAP install), you will select the Data option on the Excel ribbon and select the ‘From other sources’ option. Then select ‘From SQL Server’.
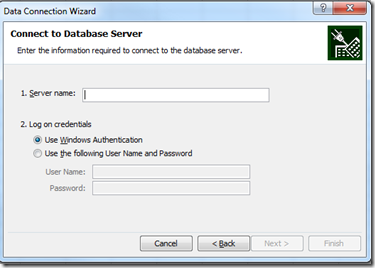
Enter your server name and instance name and click ‘Next’.
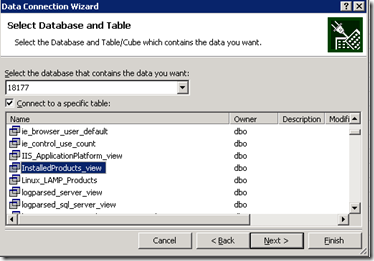
Select the database that contains the data you want and then pick InstalledProducts_view row under ‘Name’.
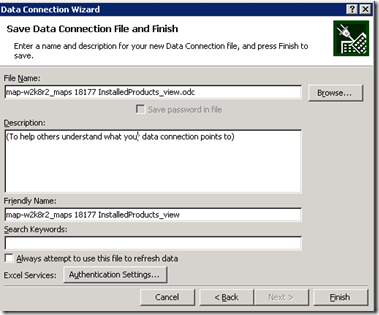
You can also add some additional information to help describe the connection. Then click ‘Finish’ and select the location where you want the query results to populate.
Using the default (LocalDB) instance
In MAP 7.0, the default database installed moved to SQL Server 2012 LocalDB. There are a couple of steps that are different than those used in other versions of SQL Server.
First, make sure that you have the SQL Server 2012 Native Client installed. You can get it from
https://www.microsoft.com/en-us/download/details.aspx?id=29065.
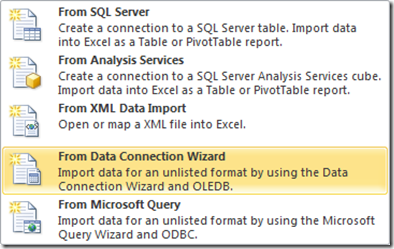
With Excel open and the Data ribbon highlighted, select the ‘From other data sources’ option and select ‘From Data Connection Wizard’
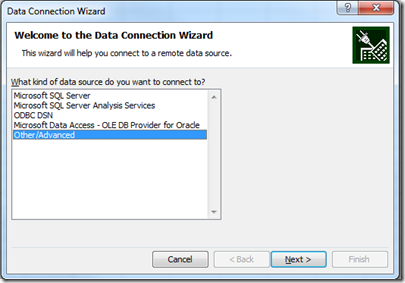
Select the ‘Other/Advanced’ option.
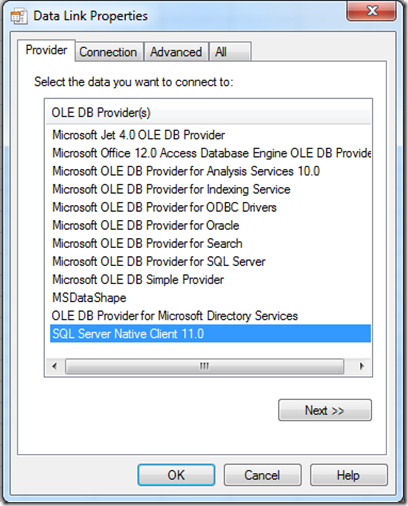
Then select the option for SQL Server Native Client 11.0 as highlighted below. If this option is not available, make sure that you have the native client installed - https://www.microsoft.com/en-us/download/details.aspx?id=29065.
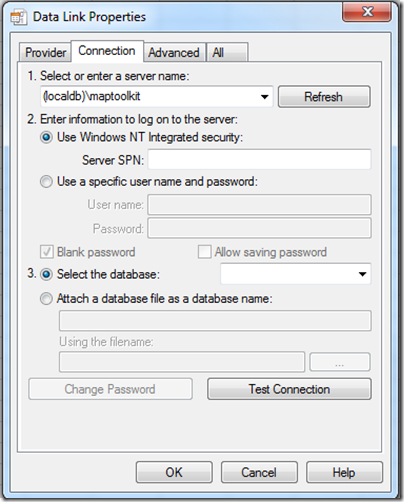
Next, you enter in the server name. If you are using the default install the server name will be: (localdb)\maptoolkit.
Set the option in #2 to Use Windows NT Integrated Security
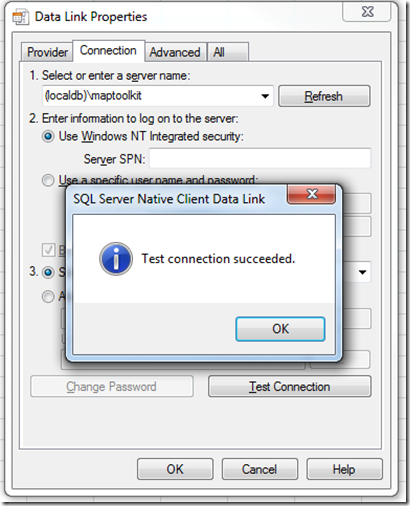
Hit ‘Test Connection’
If you’ve done it correctly, you will get a success message!
Then follow the same steps as above where you select the database name and the InstalledProducts_view.
Update for 8.0 – The reference for the InstalledProducts view has changed. If you are using a database created using MAP 8.0 – the view name has changed to [UT_WinServer_Reporting].[InstalledProductsView].
Populate the results in your spreadsheet!
What do I do next?
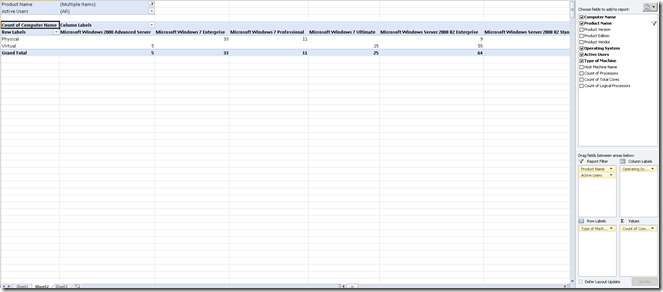
Well – that is entirely up to you. One thing that we like to do is to create a pivot table and drill down into this information. Here is one that I created. I filtered down the application name to include only those that had SQL Server components. I could look at this by physical/virtual and by operating system.
Pretty cool – huh!
For Desktop Virtualization, you can really use this to help narrow down your target audience for performance metrics or desktop workload modeling and to understand which applications are needed.
Thanks too all for their help in installing the MAP 7.0 Beta! We had a great deal of community support and feedback over the past 8 weeks! Looking forward to hearing more and more from you.
I’ll be a the Worldwide Partner Conference this week. Make sure you look me up at the ‘Best Practices using the MAP Toolkit’ sessions on Thursday!
Until next time!
Rob
