State Tiles Widget + PowerShell Widget
Dashboard options for Windows Operating System, Logical Disks and SQL DB Engine
I closely follow the Wei out there blog series as it is a great source of information on building dynamic dashboards.
A few weeks ago he posted an interesting article for showing operating system summary dashboards and one of my customers was keen to tweak this for other classes and also to integrate the dashboard with the State Tiles widget.
I spent some time looking at the code that Wei provides and found there were 4 key sections for customisation.
1. The lines where we select the classes that we want to display on the dashboard $class = get-scomclass -Name Microsoft.Windows.Server.OperatingSystem
$serverOSes = Get-SCOMClassInstance -class $class
2. The lines where we display the Discovery Data
#Get values of Logical Processors and Physical Memory properties:
$properties = @('LogicalProcessors', 'PhysicalMemory')
$properties | % {
$prop = $serverOS."[Microsoft.Windows.OperatingSystem].$($_)"
AddColumnValue $dataObject $prop.Type.DisplayName $prop.Value
3. The lines where we display the Performance Data
#Get % Processor Time Stat
if($perfRule.CounterName -eq "% Processor Time") {
$data = $perfRule.GetValues($from, $now) | % { $_.SampleValue } | Measure-Object -Average
AddColumnValue $dataObject $perfRule.CounterName $data.Average
}
#Get Processor Queue Length Stat
if($perfRule.CounterName -eq "Processor Queue Length") {
$data = $perfRule.GetValues($from, $now) | % { $_.SampleValue } | Measure-Object -Average
AddColumnValue $dataObject $perfRule.CounterName $data.Average
}
#Get % Memory Used Stat
if($perfRule.CounterName -eq "PercentMemoryUsed") {
$data = $perfRule.GetValues($from, $now) | % { $_.SampleValue } | Measure-Object -Average
AddColumnValue $dataObject $perfRule.CounterName $data.Average
}
- note that the GetMonitoringPerformanceData in $perfRules = $serverOS.GetMonitoringPerformanceData() retrieves data recorded in UTC. You may need to add some extra lines in the script to handle that as some local times may be a future date and no data will be returned like Wei did here:
#Last 16 hours
$aggregationInterval = 16
$dt = New-TimeSpan -hour $aggregationInterval
$now = Get-Date
$from = $now.Subtract($dt)
4. The lines where we do unit conversions e.g. from MB to GB (this is actually towards the start of the script, but we need to identify the discovery data and performance data before we configure the unit conversions.
$unitReplacements = @{
"Physical Memory (MB)" = @{ "name" = "Total RAM (GB)"; "coeff" = 1048576 };
}
So if we want a dashboard for Logical Disks or SQL DB Engines, how do we go about tweaking the above code? It is actually quite straight forward. We’ll start with Logical Disks:
1. Change the Class
$class = get-scomclass -Name Microsoft.Windows.Server.LogicalDisk
$serverOSes = Get-SCOMClassInstance -class $class
2. The lines we select the discovery data:
#Get values of Logical Disk Size property
$properties = @('SizeNumeric')
$properties | % {
$prop = $serverOS."[Microsoft.Windows.Server.LogicalDisk].$($_)"
AddColumnValue $dataObject $prop.Type.DisplayName $prop.Value
3. The lines where we select the performance counters
#Get % Processor Time Stat
if($perfRule.CounterName -eq "Free Megabytes") {
$data = $perfRule.GetValues($from, $now) | % { $_.SampleValue } | Measure-Object -Average
AddColumnValue $dataObject $perfRule.CounterName $data.Average
}
#Get Processor Queue Length Stat
if($perfRule.CounterName -eq "Current Disk Queue Length") {
$data = $perfRule.GetValues($from, $now) | % { $_.SampleValue } | Measure-Object -Average
AddColumnValue $dataObject $perfRule.CounterName $data.Average
}
#Get % Memory Used Stat
if($perfRule.CounterName -eq "Avg. Disk sec/Transfer") {
$data = $perfRule.GetValues($from, $now) | % { $_.SampleValue } | Measure-Object -Average
AddColumnValue $dataObject $perfRule.CounterName $data.Average
}
#Get % Free Space Used Stat
if($perfRule.CounterName -eq "% Free Space") {
$data = $perfRule.GetValues($from, $now) | % { $_.SampleValue } | Measure-Object -Average
AddColumnValue $dataObject $perfRule.CounterName $data.Average
}
How do we know what counters to select? In the SCOM console, go into Authoring, Management Pack Objects, Rules and scope to Windows Server 2012 or 2008 Logical Disk and look through the performance collection rules. To find out the counter name:
- Double click the Collection Rule
- On the Configuration Tab, click View (next to Data sources):
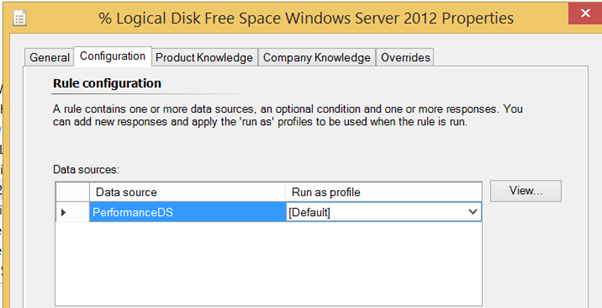
- This shows us the Counter Name that we need:
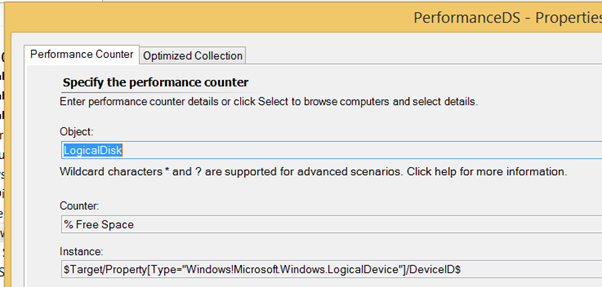
Just repeat this for the performance counters that you want to display.
4. Lets not forget that we want to change MB to GB
$unitReplacements = @{
"Size (MBytes) (Numeric)" = @{ "name" = "Size (GB)"; "coeff" = 1024 };
"Free Megabytes" = @{ "name" = "Free GB"; "coeff" = 1024};
}
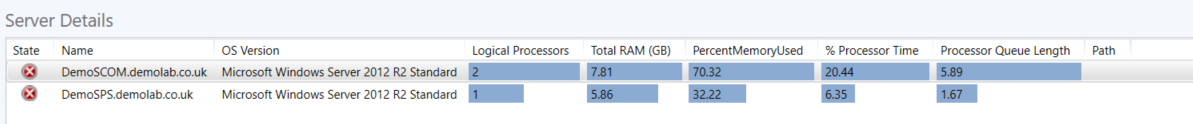
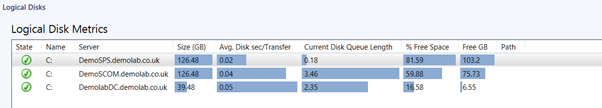
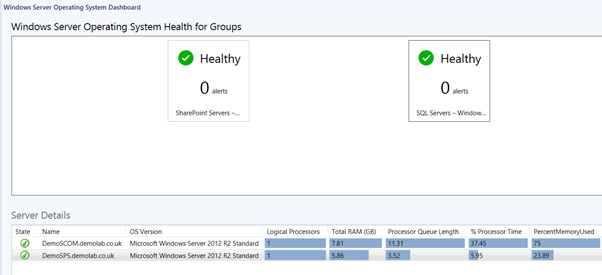
When you put it all together you get this. And when you plug it into the PowerShell Grid Widget you'll see the following:

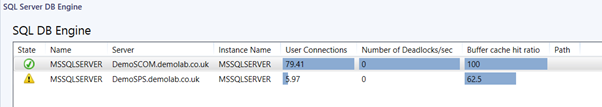
You can follow the same process for SQL Server DB Engine.
When you put it all together you get this. And when you plug it into the PowerShell Grid Widget you'll see the following:
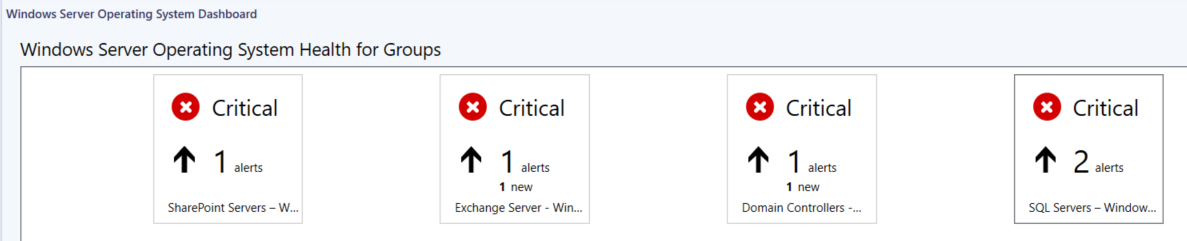
And you can even create a state view widget based on a group of Operating System objects and then make the dashboard contextual. When you select a state widget at the top, the dashboard updates with details of the servers in that group. Script
I'll be starting a new series of blog posts and Visual Studio Authoring and will use this show how we can make the groups that I use in the State tiles widget dynamic. So you can get Windows Operating System objects for your SQL Server DB Engines. And Windows Operating System Objects for your Exchange Servers.
Disclaimer:
All information on this blog is provided on an as-is basis with no warranties and for informational purposes only. Use at your own risk.
The opinions and views expressed in this blog are those of the author and do not necessarily state or reflect those of my employer.