How to Build a Consecutive Event Monitor for a Windows Azure Application in Operations Manager
Building a consecutive event monitor for a Windows Azure Application can be very useful. Azure applications should throw exceptions when something goes wrong, sometimes they are minor issues, other times they are major. Building monitoring for this can be difficult.
Should we mark an application as critical if an exception is thrown? The answer is "not always." What if the application is throwing exceptions continually? The answer is "always!" We need to measure the number of exceptions thrown per timeframe and change the state of the application accordingly.
Firstly if you are not familiar with monitoring Windows Azure Applications with Operations Manager, included at the bottom are some links to help:
Custom Monitoring Scenario: Consecutive Event Monitoring
Requirement
Operations Manager must raise an Alert if more than 5 events are received within a certain time period.
Solution
Create a monitor that will dictate the health of a Windows Azure Role Instance based on the occurrence above. An alert will be generated when the monitor enters a critical state.
A rule can satisfy the criteria set out above, however we can learn more concepts by building monitors and we can drive the state of the application.
Procedure
- Create a new Management Pack
- Create a composite module
- Create a monitor using the composite module
- Exporting the Management Pack
|
We should be using the Visual Studio Authoring Extensions, but this was written a while ago. |
 Note:
Note:
Create a new Management Pack
Open the System Center Operations Manager 2007 R2 Authoring Resource Kit
Click File>New…
In the New Management Pack dialog box on the Management Pack Template screen under Select a Management Pack Template select Empty Management Pack
Enter a Management Pack Identity. CompanyName.AppName.AppVersion.ManagementPackFunction
e.g. TestCorp.GuestBook.2012.Monitoring
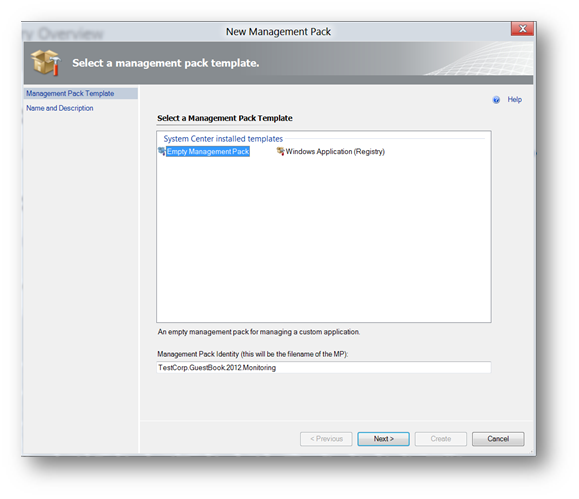
Click Next
On the Name and Description screen fill the Display Name. This usually mirrors the ID from the previous screen with spaces.
Click Create.
Create a composite module
Composite modules are composed of one or more other modules. Composite modules are included in library management packs, and custom composite modules may be defined by management pack authors for performing custom logic. Composite modules require no installation on the agent computer and are completely defined in a particular management pack. They may include native code modules, managed code modules, other composite modules, or any combination of such modules.
The Azure MP provides 3 data sources we can leverage:
- Windows Azure Role Instance Event Log Collection Simple Data Source
- Windows Azure Role Instance .NET Trace Collection Simple Data Source
- Windows Azure Role Instance Performance Counter Collection Simple Data Source
We must create a composite module containing:
- Windows Azure Role Instance Event Log Collection Simple Data Source
- A Consolidator Module - which consolidate multiple incoming data items based on a specific schedule or a time interval.
- An expression filter module - which allows the data item through or stops the data item based on the expression specified as configuration
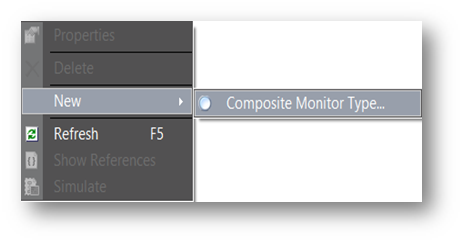
- Navigate to Type Library > Monitor Types.
- Right click the white space in the Monitor Types pane and click New > Composite Monitor Type…
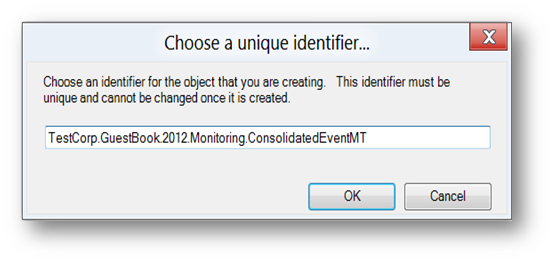
- Give a unique identifier
- On the General tab fill in Name and Description fields appropriately.
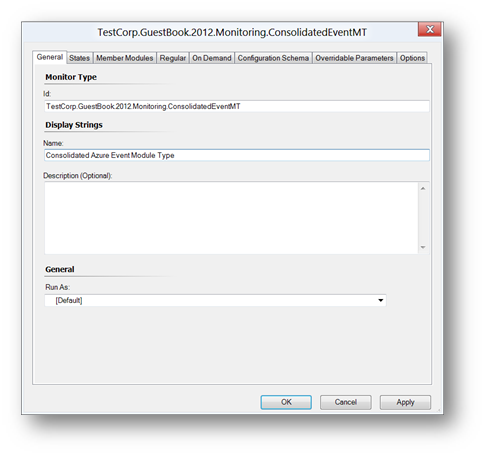
|
This consolidated module should be named agnostic of application or any variables such as EventIDs. Composite Modules can and should be reused where possible. |
 Note:
Note:
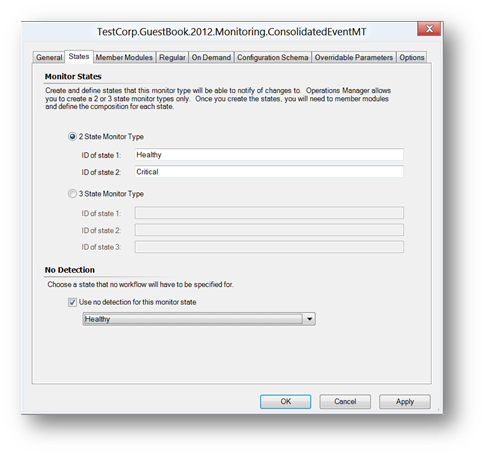
- On the States tab ensure 2 State Monitor Type is select and give an ID to State 1 and State 2
- ID of State 1: Healthy
- ID of State 2: Critical
- Under No Detection check Use no detection for this monitor state and select Healthy from the drop down. This ensure that the monitor will start in a healthy condition and will trigger an unhealthy (or Critical) condition if the criteria of the Module Type is matched.
- On the Member Modules tab click Add…
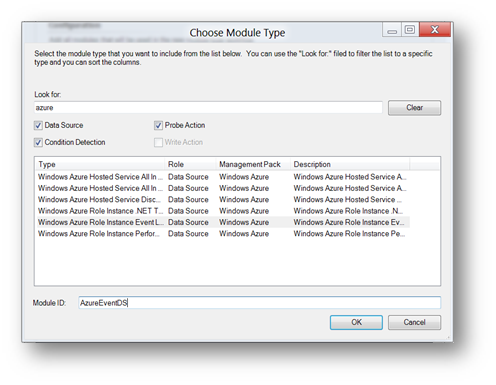
- In the Choose Module Type dialog box type "Azure" without quotes in the Look For: field. Scroll down and select the Windows Azure Role Instance Event Log Collection Simple Data Source. In the Module ID: field type a meaningful ID e.g. AzureEventDS and click OK.
- A Configuration dialog box will pop up to configure this module with some mandatory fields, the elements need to be promoted so we make them accessible by at the Monitor level. Click the Fly Out button for each field and select Promote…
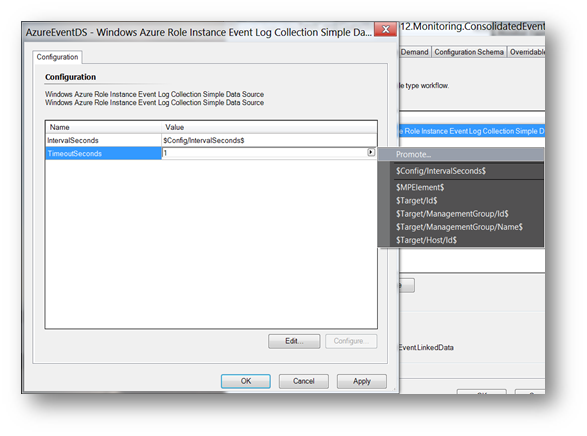
Both values should read:
- IntervalSeconds – $Config/IntervalSeconds$
- TimeoutSeconds – $Config/TimeoutSeconds$
Click OK when finished.
On the Member Modules tab click Add…
In the Choose Module Type dialog box type "consolidator" without quotes in the Look For: field. Scroll down and select System.ConsolidatorCondition. In the Module ID: field type a meaningful ID e.g. Consolidator and click OK.
On the Configuration dialog that pops up. The default counting method of the consolidator type is not suitable for our requirements. Therefore we must edit the XML to use a different counting method.
Click Edit… - if this is the first time you have entered the XML editing mode, you will need to specify a text editor.
In the Text Editor paste the following XML between the <Consolidator></Consolidator> tags
<ConsolidationProperties></ConsolidationProperties>
<TimeControl>
<Latency>$Config/Latency$</Latency>
<WithinTimeSchedule>
<Interval>$Config/TimeWindowSeconds$</Interval>
</WithinTimeSchedule>
</TimeControl>
<CountingCondition>
<Count>$Config/Count$</Count>
<CountMode>OnNewItemTestOutputRestart_OnTimerSlideByOne</CountMode>
</CountingCondition>
In the example XML, we are promoting the Latency, Interval and Count elements to be configurable outside the Composite Module e.g. in the Monitor.
We are also using the OnNewItemTestOutputRestart_OnTimerSlideByOne, this counting method uses a sliding windows rather than the default fix window.
- Close the text editor and save the contents
- Click OK and ignore the warning about the Latency element.
- On the Member Modules tab click Add…
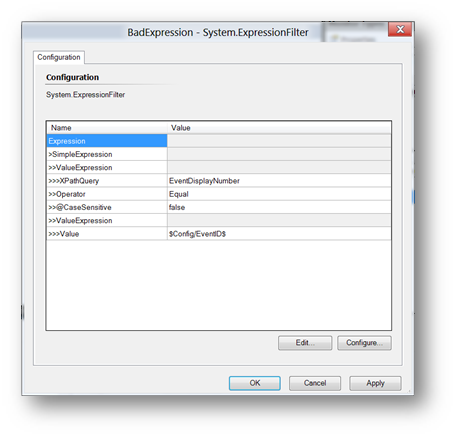
- In the Choose Module Type dialog box type "expression" without quotes in the Look For: field. Scroll down and select System.ExpressionFilter. In the Module ID: field type a meaningful ID e.g. BadExpression and click OK.
- On the Configuration dialog that pops up. Click Edit
- In the Text Editor paste the following XML between the <Expression></Expression> tags
<SimpleExpression>
<ValueExpression>
<XPathQuery>EventDisplayNumber</XPathQuery>
</ValueExpression>
<Operator>Equal</Operator>
<ValueExpression>
<Value>$Config/EventID$</Value>
</ValueExpression>
</SimpleExpression>
- Close the Text Editor and save the file.
- Review the configuration
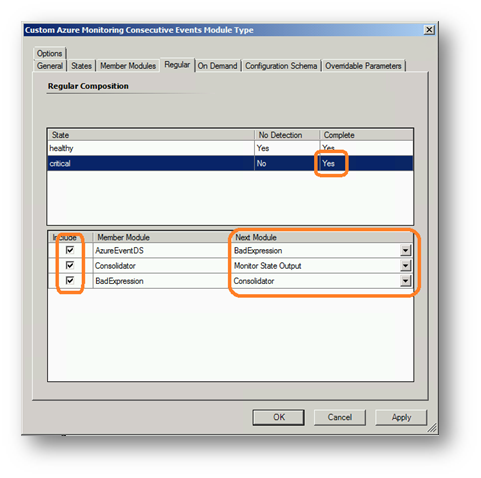
Click Regular Tab and under State select Critical, include each member module then use the drop downs to specify the order of the member modules.
Leave the On Demand tab
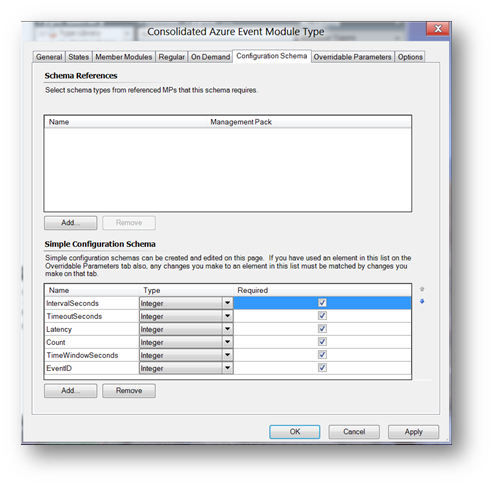
On the Configuration Schema,
Add… the following elements to the Simple Configuration Schema:
Name |
Type |
Required |
IntervalSeconds |
Integer |
Yes |
TimeoutSeconds |
Integer |
Yes |
Latency |
Integer |
Yes |
Count |
Integer |
Yes |
TimeWindowSeconds |
Integer |
Yes |
EventID |
Integer |
Yes |
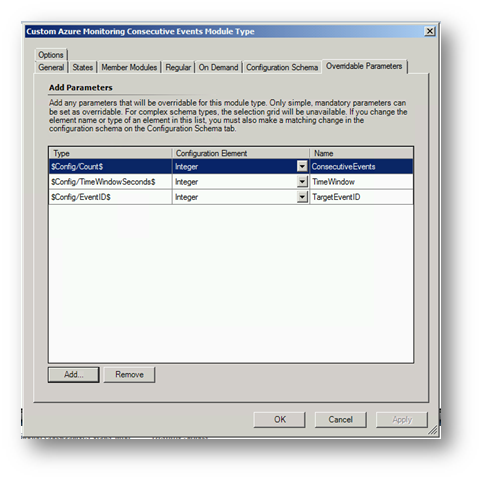
On the Overridable Parameters tab, click Add… and select TimeWindowSeconds and provide a unique ID e.g. TimeWindow. Then select Integer from the drop down for configuration element.
Repeat for Count, EventID or any parameter you want to be able to override.
Click Apply and OK to finish the Composite Module.
Save the Management Pack at this point.
Create a Monitor using the composite module
Select Health Model, then Monitors.
In the Monitors
pane right-click, select New > Custom Unit Monitor.In the Choose a unique identifier box, type an ID e.g. TestCorp.GuestBook.2012.Monitoring.AzureRoleInstance.EventsperTimeInterval. Click OK.
On the General tab, in the Name box, type a name e.g. TestCorp GuestBook 2012 Azure Role Instance Event Per Time Interval.
On the General tab, in the Target field click the ellipsis and select Windows Azure Role Instance from the Management Pack Class Chooser dialog. Click OK.
|
In step 5, we have just targetted EVERY role instance in our Azure application. This monitor would apply to; webroles & workerroles for ALL discovered Azure Applications. If we want to be more granular over which applications or roles we target, we must reference our Application specific Management Pack the MP references. Then the Management Pack Class Chooser will be populated from classes defined in that Management Pack. Remember though, sealed vs unsealed becomes an issue here. |
 Note:
Note:
- On the General tab, in the Parent Monitor field we select the most applicable parent monitor based on the nature of the Event ID in question. E.g. EventID: "666" EventDescription: "Application Down" would be an "Availability" event.
- On the Configuration tab, do the following:
- Click Browse for a type...
- In the Choose unit monitor type box, select the name of the composite module you just created e.g. Consolidated Azure Event Module Type. Click OK.
- On the Configuration Tabspecify the following values:
Name |
Value |
IntervalSeconds |
300 |
TimeoutSeconds |
60 |
Latency |
10 |
Count |
5 |
TimeWindowSeconds |
300 |
EventID |
666 |
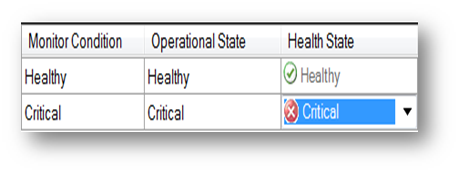
- On the Health tab, do the following:
In the Health State box for Healthy select Healthy.
In the Health State box for Critical select Critical.
- On the Alerting tab, do the following:
- Check the box next to Generate alerts for this monitor.
- In the Generate an alert when, select The monitor is in a critical health state.
- In the Alert name: box, type Consolidated Monitor Alert.
- In the Alert Description: box, you can write an Alert description using properties of the alert by using the parameters exposed by the ellipsis button. E.g.
An Event with an EventID of $Data/Context/Context/DataItem/EventNumber$ has been raised on
$Target/Property[Type="MicrosoftSystemCenterAzure!Microsoft.SystemCenter.Azure.RoleInstance"]/RoleInstanceName$ $Data/Context/Count$ times with the description $Data/Context/Context/DataItem/EventDescription$
- Click OK to save the monitor.
- Select File, then click Save.
Exporting the MP
Click Tools and Export MP to Management Group… and select your TEST Management Group
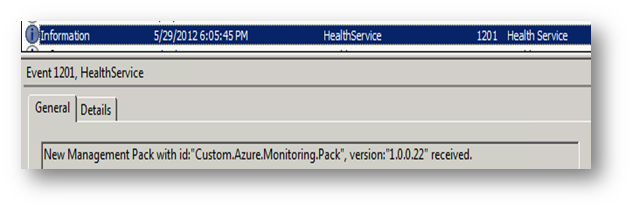
You will get a 1201 event on the target RMS (first) and proxy agent (after) to indicate a new Management Pack has been received.
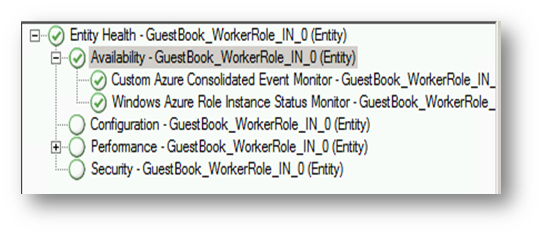
Then open the Health Explorer for a role instance and check your new monitor has been set up.
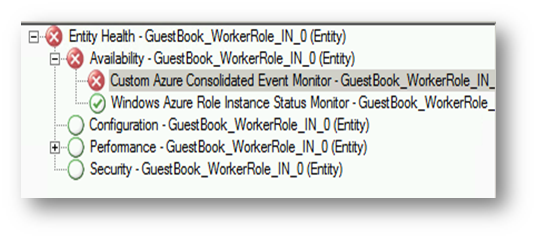
And when the application goes bad, this will be reflected all the way up the role instance on up the azure application.
References
The steps required to discover a Windows Azure Application are documented in the Monitoring Pack guide for the System Center Monitoring Pack for Windows Azure Applications (Azure MP): https://www.microsoft.com/en-us/download/details.aspx?id=11324
Management Pack Technical Writer Brian Wren: https://blogs.technet.com/b/mpauthor/archive/2011/06/20/custom-monitoring-for-windows-azure-management-pack.aspx
Attached to Brian's post is another sample MP which deals with nearly every connotation of Azure monitor known at the moment. So there's performance, events, .NET trace all that good stuff.
For more Event Logs examples, the following has some good posts on this: https://blogs.msdn.com/b/walterm/archive/2011/08/19/scom-2007-r2-event-log-alerting-and-monitoring-for-azure-applications.aspx