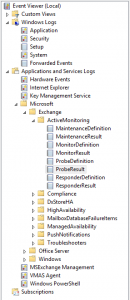
Check Managed Availability Probe Results in application log when your Exchange 2013 server has sustained high CPU
I stumbled upon this neat feature in Exchange 2013. When your Exchange 2013 (and probably later) server is experiencing sustained high CPU, an event 2 error occurs inside your Microsoft-Exchange-ActiveMonitoring\ProbeResult channel.
Look for an event with ResultName of EDS/ExchangeProcessorTimeTrigger_Warning/_total. Inside the details view, there are a bunch of top N lists that will give you quick insights into what is happening:
 <Event xmlns="https://schemas.microsoft.com/win/2004/08/events/event">
 <System>
 <Provider Name="Microsoft-Exchange-ActiveMonitoring" Guid="{ECD64F52-A3BC-47B8-B681-A11B7A1C8770}" />
 <EventID>2</EventID>
 <Version>0</Version>
 <Level>2</Level>
 <Task>2</Task>
 <Opcode>0</Opcode>
 <Keywords>0x800000000000000</Keywords>
 <TimeCreated SystemTime="2016-12-14T16:49:57.491981400Z" />
 <EventRecordID>75627993</EventRecordID>
 <Correlation />
 <Execution ProcessID="2792" ThreadID="10440" />
 <Channel>Microsoft-Exchange-ActiveMonitoring/ProbeResult</Channel>
 <Computer>EXCH2013.contoso.com</Computer>
 <Security UserID="S-1-5-18" />
 </System>
 <UserData>
 <EventXML xmlns:auto-ns2="https://schemas.microsoft.com/win/2004/08/events" xmlns="myNs">
 <ResultId>75697922</ResultId>
 <ServiceName>EDS</ServiceName>
 <IsNotified>1</IsNotified>
 <ResultName>EDS/ExchangeProcessorTimeTrigger_Warning/_total</ResultName>
 <WorkItemId>-74577656</WorkItemId>
 <DeploymentId>0</DeploymentId>
 <MachineName>EXCH2013</MachineName>
 <Error>The performance counter '\\EXCH2013\Processor(_Total)\% Processor Time' sustained a value of '89.80', for the '5' minute(s) interval starting at '12/14/2016 4:42:00 PM'.%nAdditional information:
Top 10 process time breakdown:
CPU % Process Name
279.5 w3wp#MSExchangeSyncAppPool
184.2 Microsoft.Exchange.Store.Worker
141.8 Microsoft.Exchange.Store.Worker#2
111.9 NodeRunner#ContentEngineNode1
 86.9 w3wp#MSExchangeRpcProxyFrontEndAppPool
 66.4 Microsoft.Exchange.RpcClientAccess.Service
 61.1 powershell#4
 47.3 powershell#5
 43.8 MSExchangeDelivery
 40.4 NodeRunner#IndexNode1

The total CPU in Kernel : 17.55441

\\EXCH2013\MSExchange Active Manager(_Total)\Database Mounted : 2

\\EXCH2013\MSExchange Active Manager(_Total)\Database Copy Role Active : 3

\\EXCH2013\MSExchange Search Indexes(_Total)\Crawler: Mailboxes Remaining : 0

\\EXCH2013\MSExchange Search Indexes(_Total)\Notifications: Awaiting Processing : 10247.25

\\EXCH2013\MSExchange Search Indexes(_Total)\Retry: Retriable Items : 1356622

Top 15 W3WP AppPools with the highest request rate:
Requests/sec: W3WP AppPool
 25.4 Total
 9.9 MSExchangeServicesAppPool
 4.9 MSExchangeSyncAppPool
 4.8 MSExchangeRpcProxyFrontEndAppPool
 1.8 MSExchangeRpcProxyAppPool
 1.2 MSExchangeAutodiscoverAppPool
 1.0 MSExchangeOWAAppPool
 0.9 MSExchangePowerShellAppPool
 0.3 MSExchangeMapiFrontEndAppPool
 0.2 MSExchangeOABAppPool
 0.2 MSExchangeMapiMailboxAppPool
 0.1 MSExchangePowerShellFrontEndAppPool
 0.1 MSExchangeECPAppPool
 0.0 MSExchangeOWACalendarAppPool

Top 15 components with the highest ROPs rate:
RPC Operations/sec: Component
1,977.6 _total
982.4 momt
402.9 contentindexing
333.0 airsync
159.5 transport
 79.1 eventbasedassistants
 10.5 webservices
 4.6 timebasedassistants
 2.5 owa
 1.0 availabilityservice
 0.6 storeactivemonitoring
 0.6 monitoring
 0.4 pop
 0.2 simplemigration
 0.2 management

Top 15 components with the highest RPC average latency:
RPC Average Latency: Component
 11.7 transport
 10.3 airsync
 6.4 eventbasedassistants
 5.4 _total
 4.8 contentindexing
 4.2 momt
 3.4 webservices
 1.9 management
 1.8 pop
 1.6 owa
 1.3 availabilityservice
 1.2 monitoring
 1.2 timebasedassistants
 1.1 storeactivemonitoring
 0.6 simplemigration
. Trigger Name:ExchangeProcessorTimeTrigger. Instance:_total</Error>
 ...snip...
 </EventXML>
 </UserData>
</Event>
