Using Siamese Networks and Pre-Trained Convolutional Neural Networks (CNNs) for Fashion Similarity Matching
This post is co-authored by Erika Menezes, Software Engineer at Microsoft, and Chaitanya Kanitkar, Software Engineer at Twitter. This project was completed as part of the coursework for Stanford's CS231n in Spring 2018.
Ever seen someone wearing an interesting outfit and wonder where you could buy it yourself?
You're not alone – retailers world over are trying to capitalize on something very similar. Each time a fashion blogger posts a picture on Instagram or another photo-sharing site, it's a low-cost sales opportunity. As online shopping and photo-sharing become ever more widely used, the use of user generated content (UGC) in marketing strategies has become pivotal in driving traffic and increasing sales for retailers. A key value proposition for UGC content such as images and videos is their authenticity when compared to professional content. However, this is also why working with UGC content can be more difficult as there is much less control over how the content looks or how it was generated.
Microsoft has been using deep learning for e-commerce visual search and inventory management using content-based image retrieval. Both efforts demonstrate solutions for the in-shop clothes retrieval task, where the query image and target catalog image are taken in a shop in relatively controlled settings. In this blog post we discuss how to build a deep learning model to match consumer images of outfits to identical or similar items in an online store directory using Microsoft AI tools. This task is commonly known as consumer-to-shop or street-to-shop clothes retrieval.

Specifically, we show how Azure Machine Learning (AML) and Azure Data Science Virtual Machine (DSVM) can be used to jumpstart the development of the project.
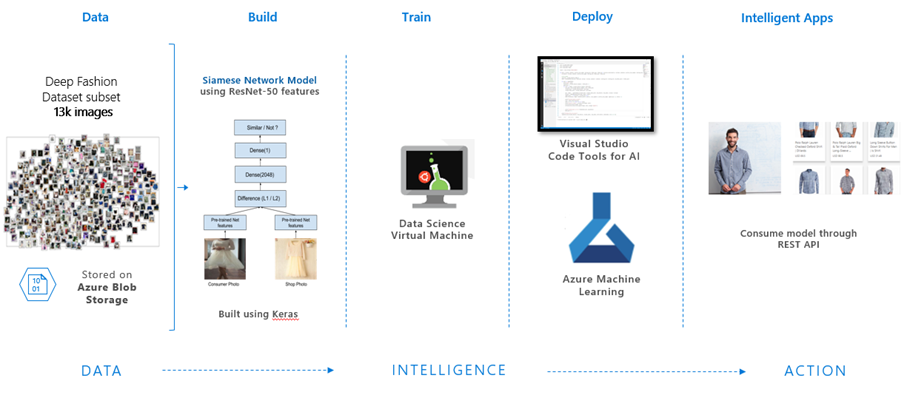
Figure 1. Architecture diagram showing Microsoft AI platform tools used to build, train and deploy our model for cross-domain visual search.
Problem Definition
In the consumer-to-shop clothes retrieval task, we try to match an image taken by a user (a form of UGC content) to an image of the same garment taken in a controlled setting, usually by a professional photographer. The images taken by users are taken on smartphones and tend to be of lower quality compared to professionally created shop catalog images. Specifically, for every new input UGC image, we want to return a list of k most similar shop images to our query image and obtain a perfect product match within our k results. A distance metric is computed between the query image and all images in a store catalog, which is then used to sort the k most similar images.
Data
We used a subset of the Deep Fashion dataset which specifically contains UGC images and store catalog images for various clothing products across different clothing categories. We used four major garment categories within which we performed our experiments. They are: Dress, Skirt, Clothing (Upper Body) and Clothing (Lower Body) visualized below in Figure 2.
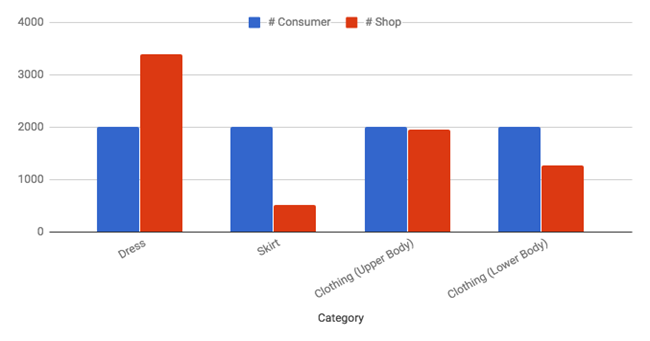
Figure 2. Number of consumer and shop images across categories.
Examples of consumer and shop images are shown in Figures 3 and 4, respectively. These examples demonstrate the complexity of the task of having to match the pattern without necessarily matching the color.
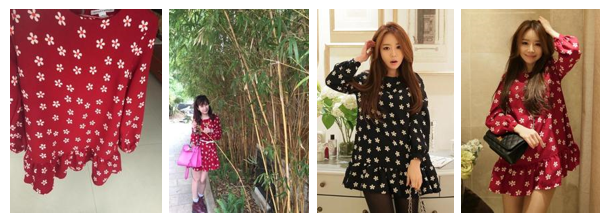
Figure 3. (L-R) Images 1 and 2 are example consumer images of a garment and images 3 and 4 are shop images for the same image.
As can be seen in Figure 3, shop images tend to have higher quality and the entire garment is in the center of the picture. One challenge with the consumer dataset is that every image has only one correct product id and so garments that that may be very similar might still be very different products, resulting in low accuracy scores. See Figure 4. To account for this, we use the top-k accuracy metric, also used in related garment similarity matching work.
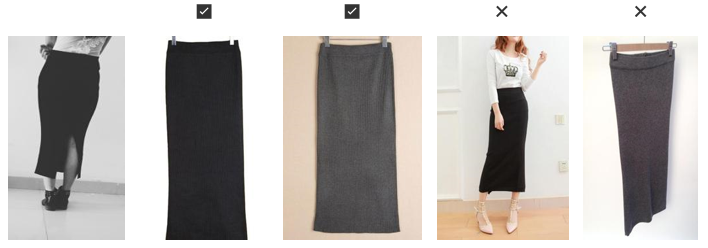
Figure 4. (L-R) Leftmost figure shows consumer image. Images 2 and 3 show correct shop images for that consumer image
and Images 4 and 5 show shop images for another product that look almost identical.
t-Distributed Stochastic Neighbor Embedding (t-SNE) is a common technique for visualizing high-dimensional datasets by projecting them to a 2D space. We used the t-SNE technique to visualize the data from extracted features of consumer images using pre-trained ImageNet models shown in Figure 5 below. Images of pants are clustered around the bottom-right and the skirts are clustered around the top-right. Images on the left are consumer images with human legs while those on the right are images against flat surfaces.
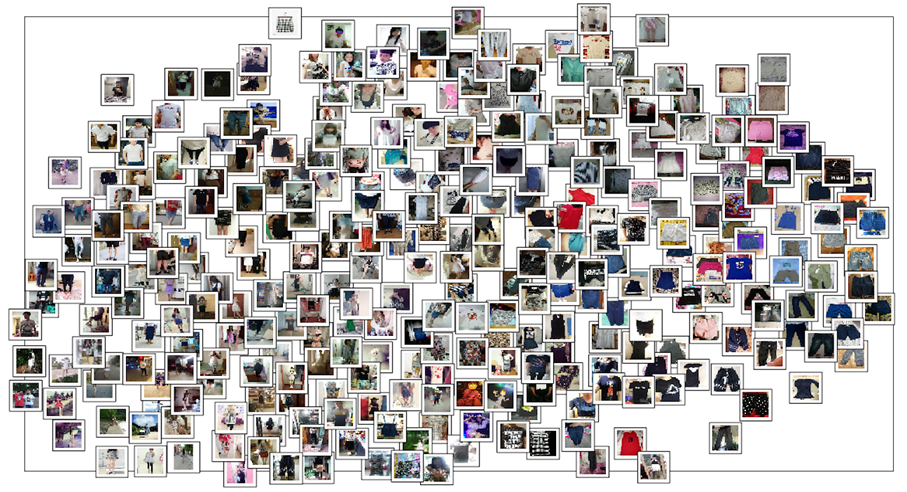
Figure 5. T-SNE for consumer images ResNet50 features.
Approach
We tried three different approaches for this problem:
- White-box features.
- Pre-trained CNN features.
- Siamese networks using pre-trained CNN features.
Each of these approaches is described in detail below.
1. White-Box Features
Our first method used white-box image extractors that have been historically used in computer vision. Once extracted, the features are concatenated to create a multi-feature representation for each image. The following features were extracted for our purposes.
- Histogram of Oriented Gradients (HOG) which counts occurrences of gradient orientations in localized portions of images.
- Color Histograms with 25 color bins that represents the distribution of color in an image.
- Color Coherence the degree to which pixels of a color are members of large similarly colored regions. Since color is such an important feature of clothing, this extractor was used to supplement the color histogram.
- Harris Corner Detection to extract corners from an image.
We compute the K-Nearest neighbors for each consumer image using the white-box features and experiment with different standard metric distances (L1, L2, Cosine). The results are shown below:
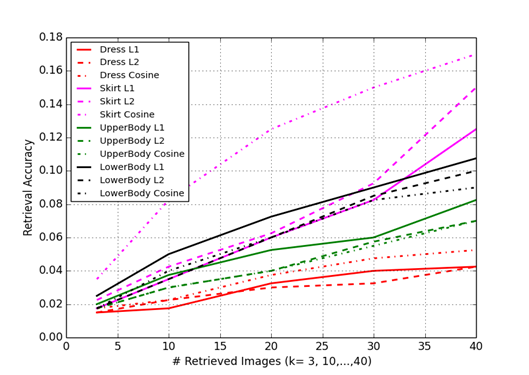
Figure 6. Category wise performance of white-box features using different distance measures.
2. Pre-Trained CNN Features
In this approach, we experiment with pre-trained CNN models used for image classification of 1000 object categories on ImageNet. We use the activations of the layers toward the end of the network as our feature representations. We experiment with VGG-16, VGG-19, Inception v3 and Resnet50 for both the consumer and shop photos and used L1 as our distance metric. The layers and number of parameters used in each of the afore-mentioned architectures is shown below.
| Architecture | Layer | Dim | # params |
| VGG-16 | 3rd to last | 4096 | 117,479,232 |
| VGG-19 | 3rd to last | 4096 | 122,788,928 |
| Inception v3 | 2nd to last | 2048 | 21,802,784 |
| Resnet 50 | 2nd to last | 2048 | 21,802,784 |
Table 1. Pre-trained neural network architectures.
The results are shown in Figure 7 below. We see an overall improvement over the extracted features with ResNet50 features having the best overall performance across all categories. We achieve the highest performance on the Skirt category with a top-20 accuracy of 17.75%.
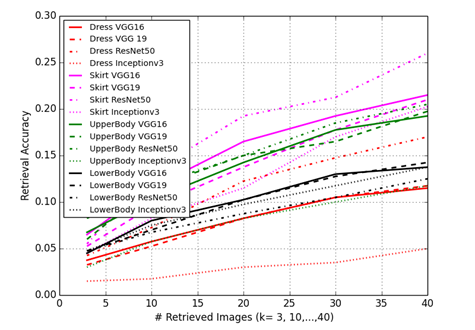
Figure 7. Category wise performance of pre-trained CNNs features.
In our previous methods, we use two steps to generate a distance metric. First, we extract some vector representation of our images either using low-level image descriptors, or features extracted from the last hidden layer of a pre-trained convolutional neural network. Then, using this vector representation, we use standard vector distance metrics like L1/L2/cosine distance. However, in this approach, we learn the distance metric using consumer and shop extracted feature pairs. We use a Siamese Neural Network to achieve this objective.
3. Siamese Networks
Siamese Networks contain two or more identical sub-networks. These sub networks generally have the same architectures and weights. Inputs are fed into the identical networks and then combined at the end into one output that measures distance between the inputs. The network is trained on this output to minimize distance between similar inputs and maximize distance between different inputs. See Figure 8 below.
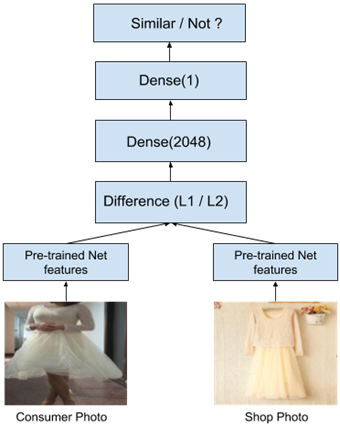
Figure 8. Model Architecture.
We use the binary cross entropy loss which is given by the formula below:

Here x1 and x2 are the consumer and shop image features respectively and t is the target which is 1 for similar pairs and 0 for dissimilar pairs. Using the Siamese Network with pre-trained ResNet50 features showed an overall performance improvement across all categories except the Dress category. We achieve the highest performance on the Skirt category with a top-20 accuracy of 26%.
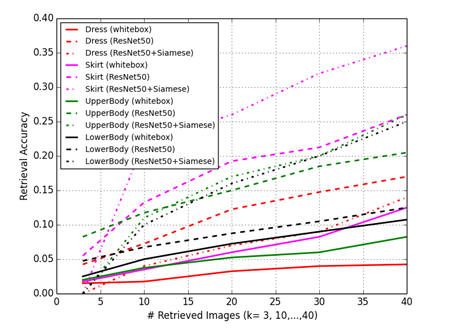
Figure 9. Category wise performance comparing results from all three approaches 1) White-box features,
2) Pre-trained ResNet50 features, and 3) ResNet50 features with Siamese network similarity metric.
We also see that for examples where the model can find the matching product (shown in Figure 10 below), the other matches in the top 20 results are semantically similar, i.e. they are the same or similar product in different colors and/or textures.
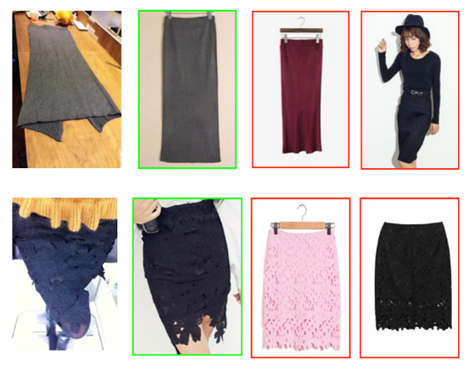
Figure 10. Correct and incorrect matches in Top k = 20 (only two of the incorrect matches are shown).
Using Data Science Virtual Machine and Visual Studio Code Tools for AI
In this section we describe how we use the Data Science Virtual Machine and Visual Studio Code Tools for AI to develop the deep learning models. In addition, we show how we can use Azure Machine Learning to operationalize the models as APIs that can be used.
- Data Science Virtual Machine.The Data Science Virtual Machines (DSVMs) are Azure VM images, pre-installed, configured and tested with several popular tools that are commonly used for data analytics, machine learning and AI training including GPU drivers and DL frameworks like TensorFlow. This saves you a lot of setup time and increases productivity.
- Visual Studio Code Tools for AI. Visual Studio Code Tools for AI is an extension to build, test, and deploy Deep Learning / AI solutions. It seamlessly integrates with Azure Machine Learning for robust experimentation capabilities, including – but not limited to – submitting data preparation and model training jobs transparently to different compute targets. Additionally, it provides support for custom metrics and history tracking, enabling data science reproducibility and auditing.
- Azure Machine Learning. Azure Machine Learning services provides data scientists and ML developers with a toolset for data wrangling, experimentation, and building, managing, and deploying machine learning and AI models using any Python tools and libraries. You can use a wide variety of data and compute services in Azure to store and process your data.
Training
We used the Azure Machine Learning Command Line Interface (CLI) integrated with VS Code to setup our DSVM as a remote compute target "my_dsvm" and used this to submit training jobs to run our experiments. To learn more about configuring different compute targets see here.
az ml experiment submit -c my_dsvm siamese_train.py
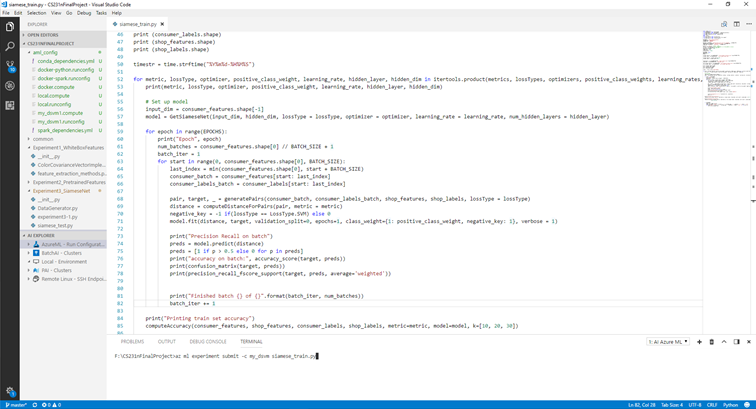
Figure 11. VS Code Editor setup using Azure Machine Learning CLI.
Deployment
We deploy our models and code in the form of a web service that can be consumed via a Representational State Transfer (REST) endpoint. For this, we use Visual Studio Tools for AI that integrates with Azure Machine Learning to deploy our model using the AML operationalization model like below:
az ml service create realtime -f score.py –model-file model.pkl -s service_schema.json -n outfit_finder_api -r python –collect-model-data true -c aml_config\conda_dependencies.yml
This will allow anyone to consume the model using a REST API. For a detailed walkthrough on deployment see this article here.
Summary
In this blog post, we discussed how to build a deep learning model to match consumer images of their outfits to the same or similar items in an online store directory. We showed how you can use Data Science Virtual Machines available on Azure and Visual Studio Tools for AI to jumpstart the building, training and deployment of the machine models. We also showed how you can easily operationalize the models using Azure Machine Learning. Our code is available on GitHub.
Erika Menezes
 @erikadmenezes
Acknowledgements
Special thanks to Ziwei Liu for making the Deep Fashion dataset available to us, and to Wee Hyong Tok for reviewing this post.
Resources
- Code for the project is available here.
- Deep Fashion dataset is available here.
- Data Science Virtual Machine documentation.
- Visual Studio Code Tools for AI documentation.
- Azure Machine Learning documentation.
- Microsoft AI Platform documentation.