Scaling Azure Container Service Clusters
This post is authored by Daniel Grecoe, Senior Software Engineer at Microsoft.
Replica sets and pods and nodes…oh my!
Microsoft has created very powerful and customizable tools for the professional data scientist with the Azure Machine Learning Workbench. The tool is used to create container images for Machine Learning or Artificial Intelligence models and exposing them as a REST API endpoints deployed and managed on an Azure Container Service. This is a very different approach than Azure Machine Learning Studio. In Studio, a model is created by the data scientist who then publishes that model as a REST API endpoint with the click of a button and the entire service is then managed by Azure.
The flexibility of the Azure ML Workbench relinquishes control to the scientist and Dev Ops teams with regards to development and operationalization. That flexibility transfers responsibility of the backend service to DevOps who must that the Kubernetes cluster is scaled appropriately for the desired load and responsiveness.
This post discusses scaling a Kubernetes cluster with Azure Container Service and walks through many of the considerations of operationalizing a container created with Azure ML Workbench on Azure Container Service but also covers basic Kubernetes considerations to meet the needs of any project.
This blog is not meant as an introduction to the Azure ML Workbench and how to develop models and publish them as a service. Those topics are well documented online:
The best place to start is by covering some very high-level basics of what a Kubernetes cluster is.
Kubernetes Cluster Basics
Kubernetes is an open source system used for managing, deploying and scaling containerized applications. The containers that are deployed with Azure ML Workbench have REST API endpoints that expose ML/AI models.
To be clear this post is also not a definitive reference on Kubernetes, however, it's important to understand a few high-level terms about the makeup of a Kubernetes cluster.
The cluster is a collection of virtual machines, called nodes, in which there are specific roles.
- Master: Also known as the apiserver, this is where communication to the rest of the cluster occurs. A master is a virtual machine that can vary in size.
- Agents: These are the nodes in which containers, also known as a pod or replica, will reside and be executed. An agent is a virtual machine that can vary in size.
- Pod: An individual instance of a container. The configuration of a pod defines the amount of CPU usage and memory, among other settings, associated with every instance.
For more information on Azure Virtual Machines visit the Azure documentation. Pricing for an Azure Container Service can be found at the Azure Pricing Calculator. The calculator has pricing for the Azure Container Service (AKS) version of the container service, so when calculating the costs, include ALL machines (masters and agents) as AKS manages the master nodes on your behalf.
| NOTE: | To make use of the information in this document you must first disable auto-scale on your Kubernetes cluster. |
How Much Processing Power Does the Cluster Have?
Docker containers run the agent nodes in a Kubernetes cluster and request a certain amount of CPU usage and memory. While memory is dynamically allocated up to the amount requested, CPU is not and therefore must be calculated out for any cluster. For those interested in understanding more about CPU usage of an individual pod, see both the Azure documentation and the Kubernetes documentation.
To calculate the available CPU units that can be allocated out to pods, it is important to understand that both the Kubernetes and Azure ML systems have overhead that is already baked into the cluster on creation. The services that are pre-installed on the cluster are:
| Service | CPU Usage | Description |
| Logging | 0.2 |
Logging system on the agent used by the system and other pods. |
| Kubernetes | ~0.5 |
A variety of Kubernetes services that support the infrastructure. |
| Azure ML Front End | 1.3 |
Regardless of cluster size there are 3 pods that run the Azure ML frontend services. These appear in the Kubernetes dashboard as pods with the name azureml-fe-[unique-id].If available, each pod will be served by a unique agent node in the cluster. |
Calculating CPU Availability / Pod Limits
To determine the processing capacity of a cluster, let us use an example cluster that has 3 – D3 virtual machines as agents. The D3 virtual machine contains 4 CPU.
Each of the agent nodes will have pods associated with logging, the Kubernetes system, and the Azure ML front end:
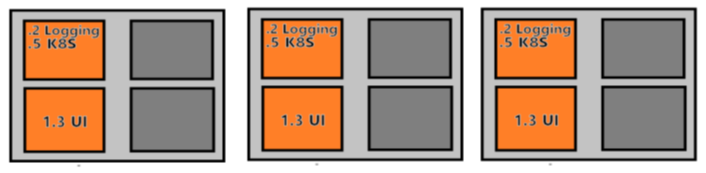
Example cluster CPU allocations before setting up pods.
As the diagram shows, these resources reduce available CPU on the cluster and hence the processing capacity for our own containers. Of the 12 original CPU, 6 of them are consumed by the core services leaving 6 available to run our containers.
For the sake of this discussion, let's assume each of our containers requires .5 CPU to process requests in a timely manner. With this configuration there is space for 12 pods.
To take it one step further, lets add one more agent node to the cluster. Since the three Azure ML Front End pods have already been located on existing agents, the next node will only have .7 CPU allocated for the logging and Kubernetes service leaving 3.3 CPU free for allocating to our pods:
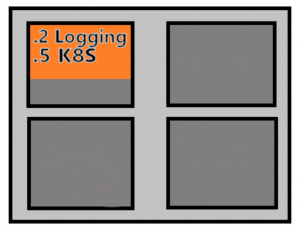
Node CPU allocation without the front-end UI pods.
This raises the processing capacity of the cluster by 50% but only increased the cluster cost by 30%! Why? Because there are now have 6 more pods running the container:
| Agent Nodes | Cluster CPU Capacity (CCC) | Container CPU Requirement (CCR) | Pod Limit (CCC/CCR) |
| 3 | 6 | .5 | 12 |
| 4 | 9.3 | .5 | 18 |
Understanding Your Performance and Requirements
Performance requirements are something every project will differ on. Do responses from the service need to occur in a specific time frame, i.e. does the service latency need to be under 500ms to produce a result? Is there a requirement on how many requests must be serviced per second? Is the model CPU-bound or memory-bound? Understanding service performance is just as crucial to cluster configuration as any other requirement. The model chosen for the service will also greatly affect performance of the cluster. To understand the model requirements the service should be tested under a load to determine the maximum latencies and system requirements of each service call.
Basic Useful Formulae
There are some basic formulae that can help jump start the journey to determining a suitable cluster size for a given service.
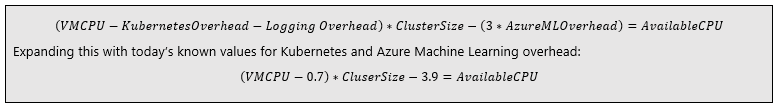
Available CPU
Understanding the system overhead allows for a simple formula to determining available CPU on a cluster.
Pod Calculation
Using the crucial pieces of information gathered while understanding performance the number of pods can be calculated; service latency under load and expected requests per second.

NOTE: MaxReplicaConcurrency is currently 1 as the backend is not currently able to manage concurrent calls. This will change in the future and therefore is included in the calculation.
Agent Virtual Machine Calculation
With the simple formulae above, it becomes somewhat trivial to calculate the cluster size required to meet a certain workload if the following information has been collected already.
- CPU allocation and latency time of the service found from testing the service under load.
- A selection of an Azure Virtual Machine type to use as the cluster agent nodes thereby identifying the number of available CPU per agent (VMCPU).

As an example, let us use a model that returns in a configurable constant time:
- VMCPU: Using D3_v2 which have 4 CPU per machine
- RequestPerSecond: 24
- ModelLatency: Constant set at 500ms
- CPUAllocation: 0.5
- MaxReplicaConcurrency: 1
To determine the size of the cluster just plug in the numbers:

In this example, the most cost-effective cluster would be a cluster of 3 agent nodes to manage the 12 pods each using 0.5 CPU. In practice, Kubernetes will allow you to allocate virtually all of the available CPU on the cluster to your service. During the scaling phase both the Azure CLI and Kubernetes will display errors with regards to that type of CPU allocation. This may take several minutes, but you can use the Kubernetes dashboard to ensure that the scaling has taken effect.
Practical: Applying Formulae
To put these formulae to the test, an Azure Container Service cluster was created and a simple ML service that sleeps on a thread for a pre-defined number of milliseconds (a constant time, low resource model) was operationalized on the cluster. The following table describes the input values to the pod formula and the expected throughput results:
| Model Latency (milliseconds) | Pods | Calculated RPS |
20 |
12 |
600 |
500 |
12 |
24 |
1000 |
12 |
12 |
Remember that the formulae are theoretical and cannot reasonably consider the following:
- Network latencies: Are the requests coming from the same geographic location? Closer gateways will physically be faster than farther machines.
- Model resources: Some models are CPU-intensive, and others are memory-intensive. These resources can alter service latencies if the system becomes overwhelmed.
- Kubernetes and Azure ML overhead: These services do not come with zero cost. For example, when the cluster starts to queue messages for a pod during a high-volume period, latencies increase.
Given these unknowns, testing the service with the constant time low resource model provides some insights through stress testing.
A test application was installed on Azure Virtual Machines in three separate geographical regions. Each application was programmed to increase the volume of traffic on the exposed cluster endpoint until it received errors. The tests varied the amount of time that the service would sleep by altering the service input.
Generalizing the results across many tests:
| Requested Model Latency (milliseconds) | % of Calculated RPS achieved |
20-100 |
65-80% |
100-500 |
85-95% |
1000 |
95-100% |
This chart shows that as the model latency decreases, the overhead costs increase. Again, the increases in overhead will vary from service to service depending on resource dependencies such as CPU and memory.
While the formulae are a good start in determining your cluster size, it is very likely that some manual adjustments to scale will be required.
Summary
We provide a set of cluster sizing formulae for setting the cluster scale starting point. These formulae are based on requirements of latency and throughput as well as testing the cluster service. These initial formulae can help guide the user to jumpstart cluster scaling, though even a simple example service may not perform exactly to the formulae. The more complex the service, the more the actual performance can diverge from the calculated performance levels. We suggest using these formulae to determine the starting point of the cluster with the given inputs of latency, CPU allocation per pod, and expected requests per second. Once the cluster has been deployed and the service operationalized on it, test the service to see determine how to modify the resources to obtain the required performance levels. Once you understand how the cluster is performing, it is trivial to scale it out and up with more pods.
It's worth repeating that there are no formulae that will definitively spit out the cluster size for you – this post is intended to give the user a starting pointtowards a performant machine learning cluster.
There are many useful documents online concerning the scaling of clusters, for instance, here's a nice one that talks about scaling for Workbench projects. I hope this post helped some of you who are getting started with Azure Container Services and Kubernetes clusters!
Daniel
Acknowledgements
- Special thanks to Shantanu Singh, a fellow Microsoft engineer, who provided in-depth details on Azure Container Service.