Using Microsoft AI to Build a Lung-Disease Prediction Model Using Chest X-Ray Images
This blog post is co-authored by Xiaoyong Zhu, George Iordanescu and Ilia Karmanov, Data Scientists at Microsoft, and Mazen Zawaideh, Radiologist Resident at the University of Washington Medical Center.
Introduction
Artificial Intelligence (AI) has emerged as one of the most disruptive forces behind digital transformation that is revolutionizing the way we live and work. This applies to the field of healthcare and medicine too, where AI is accelerating change and empowering physicians to achieve more. At Microsoft, the Health NExT project is looking at innovative approaches to fuse research, AI and industry expertise to enable a new wave of healthcare innovations. The Microsoft AI platform empowers every developer to innovate and accelerate the development of intelligent apps. AI-powered experiences augment human capabilities and transform how we live, work, and play – and have enormous potential in allowing us to lead healthier lives.
Take the task of detecting diseases from chest x-ray images, for instance. This is a challenging task, one that requires consultation with an expert radiologist. However, two-thirds of the world's population lacks access to trained radiologists, even when imaging equipment is readily available. The lack of image interpretation by experts may lead to delayed diagnosis and could potentially increase morbidity or mortality rates for treatable diseases like pneumonia.
Inspired by the CheXNet work done by Stanford University ML Group, we explore how we can build a deep learning model to predict diseases from chest x-ray images. In this post, we explain how data scientists can leverage the Microsoft AI platform and open-source deep learning frameworks like Keras or PyTorch to build an intelligent disease prediction deep learning model.
Using the Deep Learning Virtual Machines (DLVM) available on Microsoft Azure, we are able to quickly get started and focus on the task of building and training the intelligent disease prediction model using GPUs available in Azure.
In this project, we use the following resources:
- Dataset
- Technique
- State-of-the art DenseNet for image classification. DenseNet is an open-source deep learning algorithm with implementations available in Keras (using TensorFlow as a back-end). We also explored the PyTorch version of DenseNet.
- Class Activation Maps are used to understand model activation and visualize it.
- Tools and Platforms
- Deep Learning VMs with GPU acceleration are used as the compute environment.
- Azure Machine Learning is used as a managed machine learning service for project management, run history and version control, and model deployment.
The source code we provide on GitHub allows you to build the x-ray image pathology classification system in less than an hour using the model pretrained on ChestX-ray14 data. If needed, one can also recreate and expand the full multi-GPU training pipeline starting with a model pretrained using the ImageNet dataset.
The source code, tools, and discussion below are provided to assist data scientists in understanding the potential for developing deep learning -driven intelligent applications using Azure AI services and are intended for research and development use only. The x-ray image pathology classification system is not intended for use in clinical diagnosis or clinical decision-making or for any other clinical use. The performance of this model for clinical use has not been established.
Deep Learning Virtual Machines in Azure
The Azure Deep Learning Virtual Machine (DLVM) helps jumpstart your deep learning projects. The DLVM is pre-packaged with lots of useful tools that can facilitate any deep learning project – for instance, it includes installed GPU drivers, popular deep learning frameworks and environment configurations. Using the DLVM, a data scientist building models can become productive in a matter of minutes.
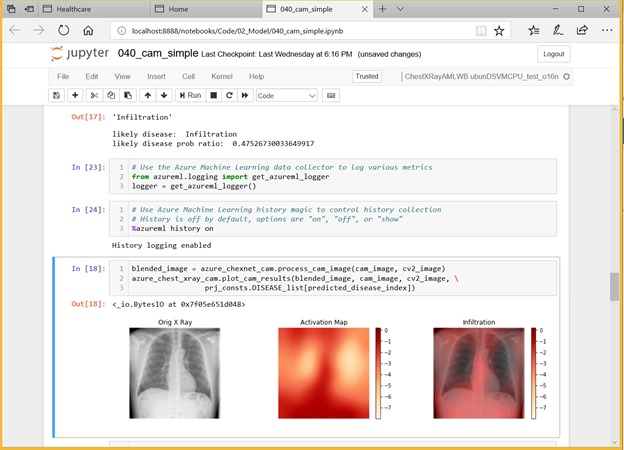
Figure 1. Building the chest x-ray disease prediction model using Azure Machine Learning.
Dataset and Preprocessing
We use a weakly labelled dataset that was released by the NIH a few months ago. The dataset is described in this paper, and you can download it from here. It includes over 30,805 unique patients and 112,120 frontal-view X-ray images with 14 different pathology labels (e.g. atelectasis, pneumonia, etc.) mined from radiology reports using NLP methods such as keyword search and semantic data integration. The NIH-released data also has 983 hand-labelled images covering 8 pathologies, which can be considered as strong labels. We train our model excluding those human labelled data and will use them for later visualization.
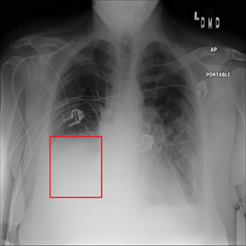
Figure 2. Chest x-ray image with atelectasis (00000181_061.png from the NIH dataset).
Training Deep Learning Network
Deep neural networks are notoriously hard to train well, especially when the neural networks get deeper. Inspired by the Stanford team, we use the DenseNet-121 architecture with pre-trained weights from ImageNet as initialization parameters. This allows us to both pass the gradient more efficiently and train a deeper model. This architecture alleviates the vanishing-gradient problem and enables feature map reuse, which makes it possible to train very deep neural networks.
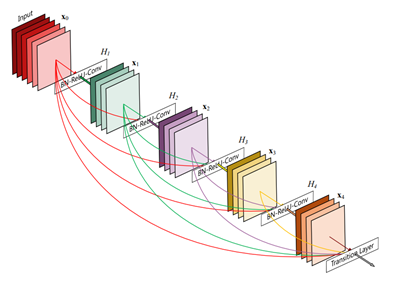
Figure 3. DenseNet architecture (source).
Following the general practice, we use the AUROC score to measure the performance for the diseases by selecting the model with the lowest validation loss.
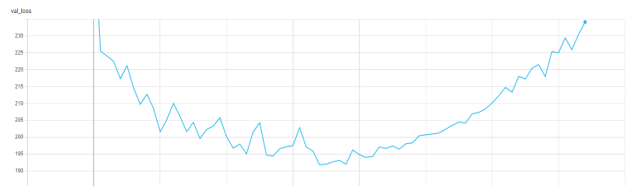
Figure 4. Validation Loss in TensorBoard.
The result we get from the model is below. The average AUROC across all the diseases is 0.845 which is state-of-art.
| Disease | AUC Score | Disease | AUC Score |
| Atelectasis | 0.828543 | Pneumothorax | 0.881838 |
| Cardiomegaly | 0.891449 | Consolidation | 0.721818 |
| Effusion | 0.817697 | Edema | 0.868002 |
| Infiltration | 0.907302 | Emphysema | 0.787202 |
| Mass | 0.895815 | Fibrosis | 0.826822 |
| Nodule | 0.907841 | Pleural Thickening | 0.793416 |
| Pneumonia | 0.817601 | Hernia | 0.889089 |
Table 1. AUROC score for all 14 diseases. The average AUROC is 0.845 which is state-of-art.
Locating Diseases Using Class Activation Mapping
Individual prediction activation maps like Class Activation Mapping (CAM) images allow one to understand what the model learns and thus explain a prediction/score. CAM methods are useful to help understand and explain model predictions. Aside from explaining model output, CAM images can also be used for model improvement through guided training. For example, one can modify the training data by removing (or relabeling) areas in the image that should not be the focus for prediction.
We use CAM visualization to understand how to interpret the classification results for new chest X-ray images. The cardiomegaly pathology bounding box from the NIH annotated data and peak CAM image show a good visual overlap, indicating that the model focuses on the right area of the image when issuing the prediction.
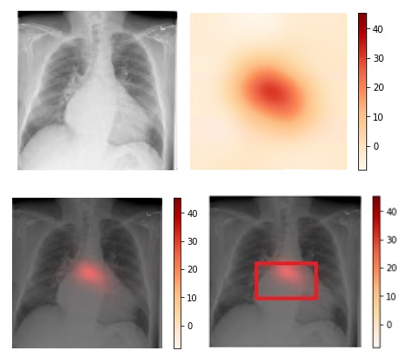
Figure 3. Upper left: Original image (00000661_000.png from the NIH dataset). Upper right: Activation map calculated by the model.
Lower left: Activation map overlay on the original image. Lower right: Activation map with bounding box delineated by human
radiologist from the NIH dataset. Bounding box and peak CAM image show a good visual overlap.
Operationalize Models on Azure
Azure Machine Learning Services enable data scientists to easily operationalize their models. To operationalize your model using Azure ML, you can leverage the command-line interface (CLI), and specify the required configurations using the AML operationalization module, like below:
az ml service create realtime -f score_chest_xray_image.py --model-file model.pkl -s service_schema.json -n azure_chest_xray_api -r python --collect-model-data true -c aml_config\conda_dependencies.yml
Solution architecture diagram:

Figure 5. AML operationalization architecture.
Exporting Models to ONNX
Open Neural Network Exchange (ONNX) provides an open source format for AI models, empowering AI developers to choose the right tools as their projects evolve. For example, you can train with your favorite framework (such as PyTorch), save your model in ONNX, then operationalize the model using another framework such as TensorFlow on the Azure ML platform.
If you are using PyTorch, exporting the model to ONNX will be just one line of code:
torch.onnx.export(model, dummy_input, "chestxray.onnx", verbose=True, export_params=True)
After exporting the model, you can visualize the ONNX model using a ONNX Viewer called Netron:
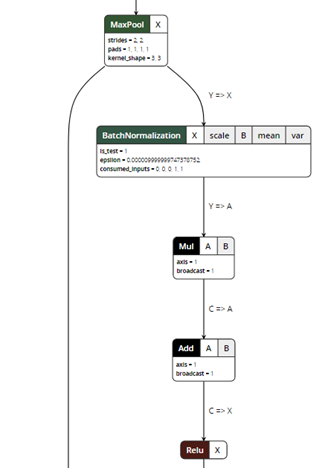
Figure 5. ONNX model visualization.
ONNX exporter is a trace-based exporter. A trace-based exporter will execute your model once and export the relevant operators that are executed during the run. This is why we need to provide a "dummy input" in the export parameters so the model can be run using the input tensors.
For PyTorch, you can directly export a model to ONNX following the instructions here. For Keras, you can use CoreML as an intermediate step to first convert Keras models using CoreML tools and then convert the CoreML models to ONNX using ONNXML Tools.
Further Discussion
Label Quality
There are several discussions in the community on the efficacy of using NLP to mine the disease labels, and how it might potentially lead to poor label quality (for example, here, as well as in this article on Medium). However, even with dirty labels, deep learning models are sometimes still able to achieve good classification performance.
The NIH chest x-ray images are provided in PNG format, down-sampled and converted from the original DICOM images. Some issues we encountered while visually reviewing sampled images include: rotated samples, images not focused on the chest, and unexpected lateral image projections (since the model assumes the images are taken from either PA or AP position). We have published a non-exhaustive list of what we believe are poor quality images in the GitHub repo, so readers can also remove those during training, which might lead to better results.
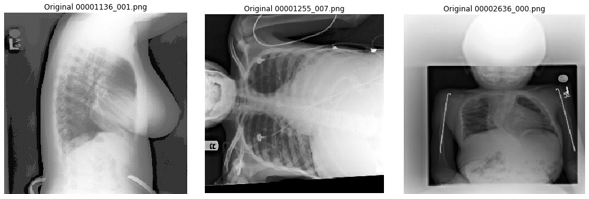
Figure 6. Examples of poorly converted images from the NIH dataset.
Pre-Processing the Data
When working on this problem, we also explored various options of improving the performance of the deep learning models, focusing on the lungs. Specifically, we explored how to detect the lung location in the chest x-ray, and crop out irrelevant areas by using a U-Net model pretrained on lung segmentation (code available from this GitHub repo), as well the Lung Finder approach. These images are then provided as inputs to DenseNet. We have also published the pre-processing code on GitHub.
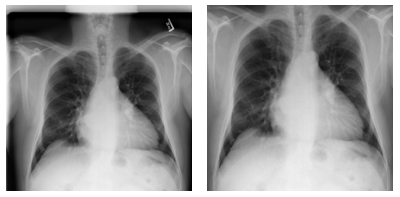
Figure 7. Examples of pre-processing data and focus on lung areas.
Left: Original image (00000001_001.png). Right: Images focusing only on lung areas. Source: NIH dataset.
Dataset Limitation
There are several limitations of the dataset which may limit its clinical applicability or performance in a real-world setting. First, radiologists often interpret chest x-rays acquired in two projections, frontal and lateral, which aids in both disease classification and localization. The NIH dataset we used in this blog only provides frontal projections (PA and AP). Second, clinical information is often necessary for a radiologist to render a specific diagnosis, or at least provide a reasonable differential diagnosis. Many chest x-ray findings are not specific to a particular disease, making it impossible to render a specific diagnosis on imaging findings alone (e.g. atelectasis, aspiration, or pneumonia). Lastly, some labels within the NIH dataset are not distinct, and many radiologists represent differing names for the same imaging observation (e.g. infiltration and consolidation). Thus, use of such labels may have an ambiguous clinical meaning.
Improving GPU Utilization
To make the training process more efficient, we also monitor GPU usage across different epochs, using the GPU Monitoring Tool by Mathew Salvaris. We monitor two epochs for both Keras and PyTorch during our experimentation, and each epoch takes around 15 min in PyTorch and around 24 min in Keras in a 2 K80 machine. We also published benchmarks comparing different frameworks and different GPUs here.
Below is the GPU utilization comparison between Keras and PyTorch for one epoch. As you can see, the GPU utilization of PyTorch (right) is always higher than Keras (left) for the same mini-batch size, with a notable drop on validation phase. Though higher GPU utilization does not necessarily lead to a faster running algorithm, it might be helpful in improving model training time.

Figure 8. Left: GPU usage with Keras. Right: GPU usage with PyTorch.
Conclusion
In this blog post, we showed how we use Azure Machine Learning to train, test, and operationalize a model to help detect pneumonia and 13 other thoracic diseases using chest x-ray images. Early diagnosis and treatment of pneumonia and other lung diseases can be challenging, especially in geographical locations with limited access to trained radiologists. Using the tools, services and infrastructure provided by the Azure AI platform, data scientists can quickly iterate and train deep learning models which have the potential, following further development and testing, to classify diseases from chest x-ray images.
Xiaoyong, George, Ilia, & Mazen
Acknowledgement The authors wish to thank Pranav Rajpurkar and Jeremy Irvin from Stanford for answering questions about their implementation, and also Wee Hyong Tok, Danielle Dean, Hanna Kim and Ivan Tarapov from Microsoft for reviewing this post.