Monitoring Petabyte-Scale AI Data Lakes in Azure
This post by Reed Umbrasas, Software Engineer at Microsoft.
Azure Data Lake Analytics lets customers run massively parallel jobs over petabytes of raw data stored in Azure Data Lake Store. During the recent Microsoft Data Amp event, we demonstrated how this massive processing power can be used to build a petabyte scale AI data lake which turns 2PB of raw text data into actionable business insights. As part of this demo, we showed an operations dashboard to visualize the solution architecture and display key metrics for each Azure service used in our architecture. The goal of this exercise was two-fold – to visualize the solution architecture and to demonstrate the ease of integrating solutions running in Azure with custom monitoring software. Integrating cloud solutions with in-house monitoring infrastructure is particularly important for many organizations that are adopting Microsoft Cortana Intelligence solutions.
In this blog post we will show how we used Azure Resource Manager APIs and Azure .NET SDKs to fetch and display service metrics in real time. Our examples will focus on Azure SQL DB, Azure SQL Data Warehouse (SQL DW), Azure Data Lake (ADL) and Azure Analysis Services. However, Azure Resource Manager APIs expose metric data for each provisioned Azure resource, so a similar approach could be extended to other architectures as well.
Solution Architecture
The illustration below shows the data flows between the different services in Azure.
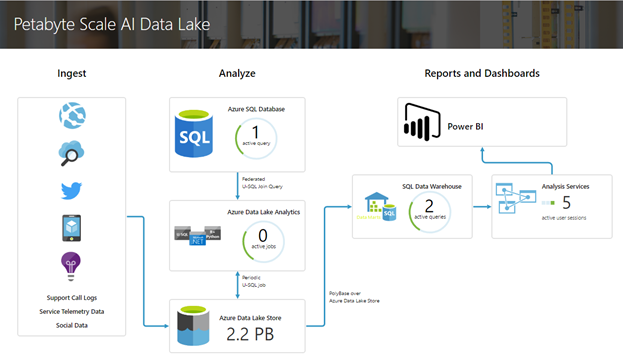
We have made the source code available from GitHub. We'll next discuss how to fetch each of the metrics displayed here.
Authenticating with Azure Active Directory
To authenticate our web app requests to Azure APIs, we will set up Service-to-Service authentication using Azure Active Directory (AAD).
First, we'll go to the Active Directory tab in the Azure Portal and register a new application with a client secret. For detailed instructions on how to do this, please refer to the Azure documentation.
Before calling any Azure API, we will need to fetch an access token and pass it in the "Authorization" header of the request. The Azure documentation provides an overview of how Service-to-Service authentication works with AAD, but for the purposes of this blog post, you can refer to the code in GitHub.
Azure Data Lake Analytics
To get the number of active jobs running in an ADL Analytics account, we will use the Azure Data Lake Analytics .NET SDK. The SDK provides an API to list the jobs in each account. We simply list the running jobs and count the result – you can see code sample on GitHub.
Azure Data Lake Store
To get the size of the ADL Store account, we will call the following REST API.
https://{account_name}.azuredatalakestore.net/StorageInsight/CustomerDataAtRest?starttime={start_time}&endtime={end_time}&api-version=2016-11-01
We will need to add the "Authentication" header to the request and populate it with a token fetched from AAD, as outlined above. The API call will return the size of ADL Store account during the specified period. We display the latest value in the dashboard.
Again, you can refer to the GitHub code sample.
Azure SQL Database and Azure SQL Data Warehouse
To get the number of active queries in Azure SQL DB and SQL DW, we must first establish a connection using ADO.NET. You can find the right connection string to use in the Azure portal.
Next, we query the "sys.dm_exec_requests" table in SQL DB and the "sys.dm_pdw_nodes_exec_requests" table in SQL DW to get a count of active queries.
SELECT count(*) FROM {table name} WHERE status = 'Running';
There is a wealth of information that can be gathered by querying those tables for building more complex dashboards. For more details, please refer to the SQL Server documentation.
Azure Analysis Services
To get the number of active user sessions in Azure Analysis Service, we will call the following REST API:
https://management.azure.com/providers/Microsoft.AnalysisServices/servers/{aas_server}/providers/Microsoft.Insights/metrics?api-version=2016-06-01&$filter=(name.value eq 'CurrentUserSessions') and (aggregationType eq 'Average') and startTime eq {start_time} and endTime eq {end_time} and timeGrain eq duration'PT1M'
This API call will return the average user session count over the specified period at a 1-minute granularity. We simply take the latest value and display it on the website. Please refer to the GitHub code sample.
Retrieving Metric Definitions from Azure Resource Manager
At this point you might be wondering where to find the metric definitions for a given Azure resource, i.e. if we provisioned an Azure Analysis Services account and we now want to know what metrics are provided by Azure. The REST API below will return a list of all metrics that are provided for the given resource:
Based on the list returned, you can choose which metrics you are interested in. For more information on this topic, please refer to the Monitoring REST API walkthrough article in the Azure documentation.
Conclusion
In this blog post we demonstrated how custom monitoring solutions can retrieve Azure resource operational metrics. Once retrieved, this data can be displayed, persisted, sent to a third-party monitoring infrastructure, etc. This allows Azure customers to fully integrate their Cortana Intelligence solutions with their existing monitoring infrastructure.
Reed