Data Mining the 2016 Presidential Campaign Finance Data
So you just got yourself a brand new dataset.
Now what?
How do you prepare a dataset for machine learning?
Where do you even begin?
This post is an attempt to demystify this process, using a fun example that is of topical interest.
Dataset Selection
Since we are in the middle of the U.S. presidential elections, let's use the free and publicly accessible campaign finance dataset, provided by the Federal Elections Committee (FEC). Specifically, we will be using the Contributions by Individuals dataset for the 2015-2016 election cycle. Under US Federal law, aggregate donations of $200 or more by an individual must be disclosed. This dataset represents the itemized transactions where individuals donate to the political campaigns of candidates, political action committees (PACs) or national party committees.

This article will try to show to the user how to receive a brand new dataset, formulate a data mining question and how to process the data to get ready for machine learning.
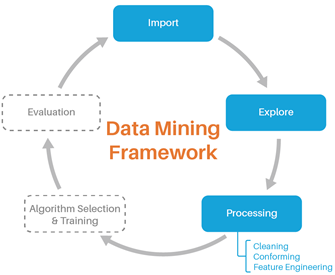
Data Mining Process
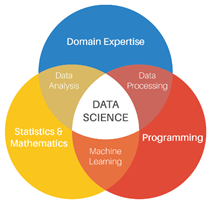
Every data mining solution is tailored to the data at hand and the question it is trying to answer, so there are no cookie cutter solutions. This blog post walks users through the general thought process when approaching a new dataset. We'll begin with the data mining framework, which can help guide the "next-steps" thought process in data mining. For this exercise we'll use a combination of R programming, SQL, and Azure Machine Learning Studio.
Method |
Tools |
 |
 |
Import and Conversion
We'll be using R to perform the initial importing. We have provided a sample R script for loading in and converting this dataset to CSV format.


Some things to note:
- The data file is pipe ("|") delimited: this will be solved by using the read.table() command, which lets us specify less conventional flat file delimiters. We will also convert a copy to CSV for ourselves since it's the most versatile flat file format and will allow us to use other tools such as Excel, PowerBI, or Azure ML Studio.
- The file does not have headers included: the list of headers and their descriptions are actually in a separate file. These will have to be renamed and included after the initial read-in.
- The file is large. At a whopping ~2.8 GB, it will take about 15 minutes to read in and will require about 6 GB of ram to read into memory with R. You may need a virtual machine for this step if you are on a particularly modest machine.
This is a dynamically changing dataset that is updated almost daily. As of the date of writing of this post (9/30/2016), the dataset is 2.8 GB with 12,575,590 rows and 21 columns. We'll now use the power of the cloud by importing the data into Azure ML Studio. We published the entirety of this experiment into the Cortana Intelligence Gallery where you may clone and follow along.
|
Clone this experiment in Azure Machine Learning Studio |

Asking Questions of Your Data
A simplified view of ML is that you ask a question of your data, framing historical data in a way that the predictive model will be able to answer for future cases. This dataset is quite versatile and can be adapted for a host of solutions. Some example questions that have been asked of this dataset by other data miners and researchers are:
- Predicting congressional votes based on campaign finance data
- Predicting the passage of bills
- Predicting ideologies of American lawyers
- Predicting the probability that a transaction is going toward a democrat or republican committee
In the spirit of the election, let's setup the dataset in a way to identify transactions to Hillary Clinton or Donald Trump. To do that we will need to identify and label each transaction (supervised learning) that went toward Clinton or Trump. From then it can become a classification machine learning problem.
The individual transactions dataset also contains transactions to all Senators, all House of Representatives, and all Presidential candidates running for election. Those will have to be filtered out, which will be explained in the next section.
Tracking Transactions to the Clinton or Trump Campaigns
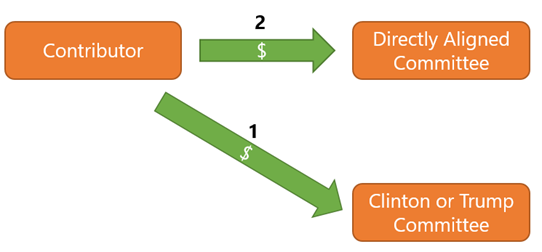
The dataset represents individual donations to committees and each committee is identified by "committee id". By identifying which committees are associated directly with which candidate, and filtering for just Clinton or Trump, we can identify transactions that are for their respective election campaigns. Transactions where the contributor (1) donated directly to the official candidate campaign, or (2) donated to a committee that is aligned with a single candidate, are included.
Pulling in Reference Data
Luckily there's a committee linkage file which shows the existing relationships between committees to candidates (if a relationship exists) by "candidate id" and "committee id". There also exists a candidate master file which lists out every candidate by "candidate id". Lastly there is a committee list that lists out every committee by "committee id".

Extend this experiment:
By cross-referencing in this manner, we are ignoring issue advocacy PACs, candidate leadership PACs, and National Party Committees (such as the RNC and DNC). The political preference of donors to these committees can often be inferred by how closely a candidate is aligned with an issue or political party. However, as they have not donated directly to the campaigns we're referencing, we've excluded them for our purposes here. To provide a larger data set, you may opt to include donors to these organizations as well.
Finding Clinton or Trump Committees
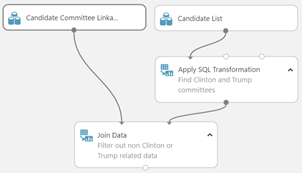
A SQL query can be applied to the candidate master file to the "candidate id" for both Clinton and Trump to filter out the other 7,224 candidates in the list. We will then perform an inner join on "candidate id" to filter out only the rows (committees) that are officially aligned with Trump and Clinton. The result is that we find 6 committees that are officially aligned with Clinton or Trump.
Understanding the Domain
Domain expertise or research into the data is crucial to develop sound models. Upon interviewing a domain expert, we found that candidates also get direct funding from victory funds committees. A SQL query to the candidate list to find committee names with the words "victory" and followed by either "Clinton" or "Trump" reveals the "committee ids" for both Clinton's victory fund and Trump's victory fund.
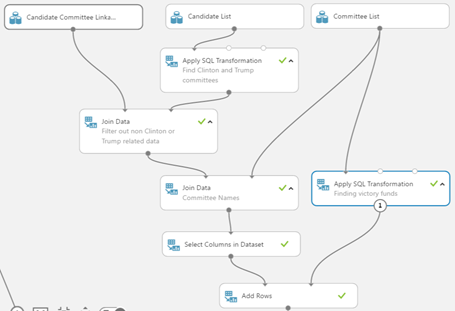
Scoping Down to the Data
In the end we find that there are 8 "committee ids" that we need to look out for within the individual transactions dataset. A final inner join of individual transactions dataset by the 8 committees will filter out all non-related transactions. After the filtering the data is reduced to 1,004,015 relevant rows from its original 12,575,590 rows.
Extend this experiment:
This experiment can easily be adapted to label other candidates as well, such as Ted Cruz or Bernie Sanders.
What's in the Data?
The results are quite fascinating. Among the reported transactions in this dataset, only 5.8% out of the 1,004,015 transactions were for Trump, representing 58k transactions. Keep in mind that many low dollar value gifts (below $200) are not reported in this dataset. The data also shows that Hillary transactions total $298 million while Trump raised $50 million from individual contributors. This is a steep asymmetry of the class labels that seems abnormal for presidential campaign elections and is therefore researched further in the section that follows.
Transaction Frequency by Candidate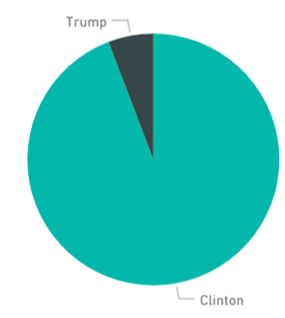
You can reproduce this pie chartusing this R code. |
Dollar Amount Raised by Candidate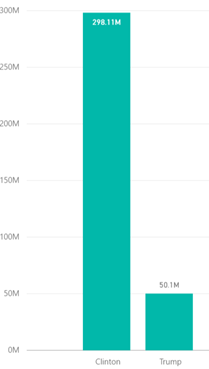 |
Researching the Asymmetry
Upon further research to see if this asymmetry is based upon error, Trump has raised $127,980,237 total this cycle, $19,370,699 from itemized individual donors, whereas Clinton has raised $315,353,001 total this cycle, $200,132,873 from itemized donors. To put this in perspective, President Obama raised $722,393,592 in the entire 2012 cycle, $315,192,451 from itemized individual donors.
It should be noted that Trump subsidized his primary campaign effort with much of his own funds, contributing a total of $52,003,469. He did not begin fundraising in earnest from individuals until after he was the presumptive Republican nominee in May of 2016.
- Trump fundraising operation ramping up
- Trump's July fundraising numbers
- Trump/RNC announce joint fundraising deal
In the end the asymmetry between Trump and Clinton transactions does not seem like an error and must be dealt with using data mining techniques described later.
Feature Selection
Feature selection is normally done as the last step prior to machine learning. However, working with a large data set continuously will bog down the running times of any tool that we may use. When working with large datasets, it is recommended to perform feature selection relatively early and drop unnecessary columns.
From the individual contributions dataset, we will use the following features as predictors or engineered into features:
| Feature | Description |
| NAME | The donator's name. Can be used to predict user gender. |
| CITY | The city address of the donator |
| STATE | The state address of the donator |
| OCCUPATION | The occupation of the donor |
| TRANSACTION_AMT | The amount of donation in this transaction |
The remaining columns will be dropped from the dataset.
Extend this experiment:
The "memo" column contains important clarifications on each transactions, e.g. if a given transaction was a refund, an earmark, etc. Research into this column can yield a more granular dataset for the model. The "image number" column also contains within it the month and day of the receipt's scan. Extracting the day of the week can yield other interesting features such as whether it's a holiday or not.
Feature Engineering with External Datasets
Never look at the data in front of you in isolation but consider the world as your data source. Extra data can always be pulled in to improve the model. In this dataset we have access to contributor's names. Luckily the US Social Security Administration keeps a record of every baby name filed at birth, their year, and gender. By doing statistical aggregations of first names by gender, we can predict contributor's genders based upon their first names. For example, 64% of all people named "Pat" that were born in the US between 1932 and 2012 were male, therefore a contributor with the name "Pat" would be classified as male. There also exist titles such as Mr. and Ms. which are even better predictors of gender.
Extracting First Names & Titles
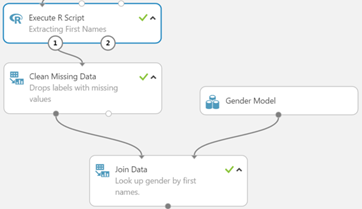
Currently the contributor names include their full names. We will extract first names and titles using R within the execute R script module within Azure Machine Learning.
Names and titles were extracted for all but 33 rows.
Predicting Gender by First Names
We import a gender model table where 17,597 unique names and titles and their associated predicted gender label. From this we can perform a left-outer-join to look up gender values. Left-outer-join allows us to keep transaction rows that don't have a gender lookup value.
Reducing Number of Categorical Levels
To avoid the curse of dimensionality, we have to reduce the number of categorical levels present within our dataset.
- Occupation: This column represents people's jobs. People were allowed to fill in this field themselves, free-form. As a result, there are a large number of misspellings. The word "veteran" can also be found as "veteren", "WWII vet" and "vetren". As a result, there are 33,456 distinct occupations our dataset. Luckily the Bureau of Labor Statistics has done by classifying each job title into one of 28 occupational type buckets for us. We wrote an R script in Azure ML to do this bucketing.
- State:There are 60 states in this dataset – the 50 US States, Washington DC and 9 additional territories, representing overseas military bases, citizens working abroad, or other territories such as Pacific Islands. However, these extra 9 states only account for 4,151 rows, which is less than half a percent of data which means there may not be enough representation to learn from these categories. We will use a SQL statement to filter out only the 50 main states plus Washington DC.
- Cities: There are 11,780 distinct city names. We will run a SQL query to filter out city and state combinations that don't have at least 50 transactions. We filter these out because there are not enough observations to form representation within the dataset. This threshold becomes a tuning parameter that you can play with. Increasing it may improve the overall performance of your models at the cost of less granularity for the inclusion of a specific city. After the filtering, 2,489 cities remain.
- Contribution amounts: This feature does not have to be bucketed. However, in the experiment we show that you can bucket numeric features by quantile percentages.
Cleaning Missing Values
All columns have missing values. For simplicity, all missing values were replaced with a separate category called "OTHER". However, it is advised at this step to experiment with different methods of missing value cleansing to see if there is a performance increase. Missing categorical features can be cleaned using the mode or can be imputed via another predictive model to predict the missing value.
Note that any rows containing missing values of the response label have to be removed because supervised learning models can only learn if there is a label present for a given row.
Dealing with Class Imbalance We return to the class imbalance from earlier. Class imbalance is quite common in ML, where one class is rarer than another. Some examples include medical diagnosis of tumor cells, a certain hormone that signifies pregnancy, or a fraudulent credit card transaction. There are many ways to combat class imbalance, however the one that is employed here will be to down sample the common class or to oversample the rare class. Clinton's transactions were randomly sampled down (6.2%) to match Trump's 58k transactions. This sampling percentage also becomes a tuning parameter for future predictive models.
Visualizations, Exploration, and Segmentation
Segmentation by Gender
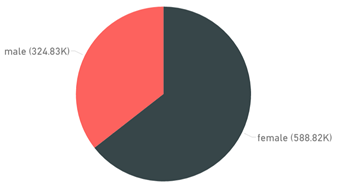
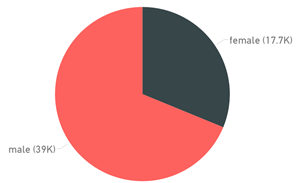
If gender is segmented by Clinton or Trump we get some pretty different looking pie charts: 64% of Clinton's transactions come from female contributors, whereas 68% of Trump's transactions originate from males.
| Clinton Transactions by Gender | Trump Transactions by Gender |
|
|
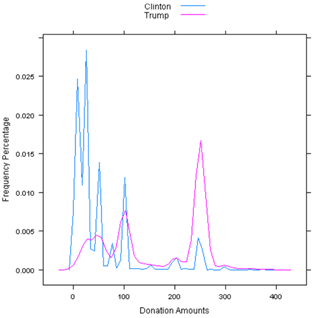
Donation Amount Frequency, Segmented by Clinton and Trump
As stated above, any inferences we make only apply for the subset of transactions within our current dataset, because of the way we have set things up. This leaves out many transactions such as the JFC, DNC, RNC and non-publicly affiliated committee transactions.
A density plot is a nice way to visualize how the data is distributed. The x-axis represents the donation amounts and the y-axis shows frequency of donations at this level. For example, it would seem that in this dataset, about 27% of Clinton's itemized contribution transactions amount to $25 or so, whereas about 17% of Trump's contributions were for sums of $250 or thereabouts. What's more important in this segmentation is to pay attention to the ranges at which one segment is higher or lower than the other. Lower level donations (less than $60) are almost all for Clinton, meaning - of her itemized donors - most come in small amounts. Once again, keep in mind that we are missing a lot of unreported transactions since only transactions of $200 or more from an individual donor need to be disclosed.
Next Steps
There are several opportunities to enhance this project. For instance, we dropped several features that could be used for further feature engineering. To take an example, the "memo" column contains important clarifications on each transaction, such as whether a given transaction was a refund, earmark or something else that may be of interest. Research and extraction into this column can yield a more granular dataset for the model. Similarly, the "image number" column contains within it a month and day of the receipt's scan, and extracting the day of the week could yield interesting features such as whether or not it was a holiday.
Even without these enhancements, the data is now in a state where you can feed it into one of many machine learning algorithms to build a model. To see how Azure ML can be used to build models, check out our Gallery, which features several interesting models shared by members of our community - you can get yourself jump started there. We hope you have fun. Do let us know if you end up using this data in interesting ways.
Cortana Intelligence & ML Blog Team