A Linear Method for Non-Linear Work: Our Data Science Process
This post is by John Ehrlinger, Data Scientist, and Basri Dogan, Project Manager, at Microsoft.
Introduction
"Failing to plan is planning to fail" - Alan Lakein
When you are approached by a customer, can you describe the process you will use to ensure that your project will succeed? As data scientists, we almost certainly have some sort of a process we work through. We can even point to places where we are being asked to short cut that process, but can we describe the steps to proceed from project start to finish?
The KDNuggets Methodology Poll (Piatetsky-Shapiro 2014) regularly surveys data scientists on methodology usage. Although formalized methods such as the Cross Industry Standard Process for Data Mining (CRISP-DM) (Wirth 2000), Knowledge Discovery in Databases (KDD) (Fayyad, Piatetsky-Shapiro, and Smyth 1996), and Sample, Explore, Modify, Model and Assess (SEMMA) (Rohanizadeha and Moghadama 2009) are regularly score very high, a large percentage cite "my own" or "my organizations" method as their primary approach to project management.
In this article, we present our version of what "my own" process management might look like. This process closely parallels the formalized methods mentioned with well-defined boundaries and goals and clear guidance on expected deliverables. Our 7-step process was developed in response to a customer request for insight into how a data science project would proceed, and in an effort to estimate time to completion. We assume a linear approach toward project completion similar to waterfall method. However, we also understand that data science is an exercise in discovery, and requires returning to previously "completed" steps as new information is uncovered or becomes available.
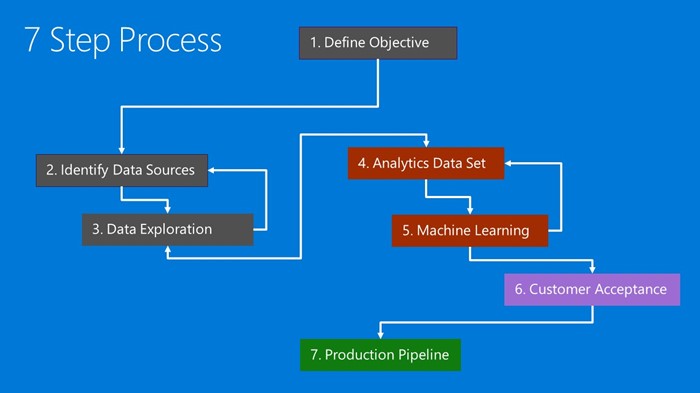
Figure 1: The data science planning process
The core idea of our data science process is encapsulated in a series of 7 major milestones. Figure 1 details the progression through each of the milestone steps. At the core, each milestone should:
- Proceed progressively on to the next milestone.
- Provide predefined checkpoints to ensure the project is progressing satisfactorily and that requirements are met before they block progress.
- Provide communication/documentation points to track progress.
We also recognize that there are dependencies between milestones, and indicate how the workflow progresses with arrows between milestones. For instance, as new data sources are discovered, new data exploration will be required. The exploration exercise may then uncover the need for additional data to be collected in order to answer the question of interest. Similarly, we almost always build an analytic data set in parallel with our machine learning model. New insights from the model could drive different feature engineering steps, or the need for more data.
In the remainder of this article, we will describe in detail each of the seven milestones and how our process proceeds toward meeting the customer's data science business objectives. The document outline follows the process as detailed in Figure 1.
1. Define the Project Objective
Goal: Clearly and explicitly specifying the model target as a sharp question which is use to drive the customer engagement.
Responsibility: This will be customer driven to maximize business value, with guidance from the data science team to make the end objective answerable and actionable.
The first step towards a successful data science project is to define the question we are interested in answering. This is where we define a hypothesis we'd like to test, or the objective of the project. It helps to describe what the expected end result of the engagement would be, so that we can use these results to add business value.
A key component of successful data science projects is defining the project objective with a sharp question. A sharp question is well defined and can be answered with a name or number. Remember that data science can only be used to answer five different types of questions (Rohrer 2016):
- How much or how many? (regression)
- Which category? (classification)
- Which group? (clustering)
- Is this weird? (anomaly detection)
- Which option should be taken? (recommendation)
The type (or class) of the question restricts and informs the following:
- Which algorithms the data scientist can use to address the problem.
- How to measure the algorithms accuracy.
- Data requirements.
A success metric is typically determined by which question is asked. The metric is defined by how we measure accuracy within that question class. Once we have an idea of the measure, we can discuss what success would look like in terms of this metric.
Deliverable: Project Objective This is usually a single-page document clearly stating the question of interest and how the expected answer will look. The document should also include some criteria for customer acceptance of the final solution and an expected implementation of the solution.
We can think of this as an initial contract that defines the customer expectations in terms of an achievable end point of the engagement. This is often an exercise that is completed in collaboration between the customer and data science team. This deliverable will prove to be valuable as it encourages customer engagement in the process.
2. Identify Data Sources
Goal: Clearly specifying where to find the data sources of interest. Define the machine learning target in this step and determine if we need to bring in ancillary data from other sources.
Responsibility: Typically, the customer comes with data in hand. With a sharp question, the data science team can begin formulating an answer by locating the data required to answer that question.
Just because we have a lot of data does not mean we will use it all, or that it contains all that we need to answer the question. In addition, all data sources are not equally helpful in answering the specific question of interest. We are looking for:
- Data that is Relevant to the question. Do we have measures of the target and features that are related to the target?
- Data that is an Accurate measure of our model target and the features of interest.
We are typically using data sources that are collected for reasons other than answering our specific question. This means we are collecting data sources opportunistically, so some information that could be extremely helpful in answering the question may not have been collected. We also are not controlling the environment of observations, which means we are only able to determine correlations between collected information and the outcome of interest, not specific causal inferences.
Deliverable: Data Sources Usually a single-page document clearly stating where the data resides. This could include one or more data sources and possibly the associated entity-relation diagrams. This document should also include the target variable definition.
3. Initial Data Exploration
Goal: To determine if the data we have can be used to answer the question. If not, we may need to collect more data.
Responsibility: Data science team begins to evaluate the data.
Once we know where to find the data, this initial pass will help us determine the quality of the data provided to answer the question. Here we are looking to determine if the data is:
- Connected to the target.
- Large enough to move forward.
At this point graphical methods are extremely helpful. Have we measured the features consistently enough for them to be useful or are there a lot of missing values in the data? Has the data been consistently collected over the time period of interest or are there blocks of missing observations? If the data does not pass this quality check, we may need to go back to the previous step to correct or get more data.
We also need enough observations to build a meaningful model and enough features for our methods to differentiate between different observations. If we're trying to differentiate between groups or categories, are there enough examples of all possible outcomes?
The initial data exploration step (step 3) is done in parallel with identifying data sources (step 2). As we determine if the data is connected or if we have enough data, we may need to find new data sources with more accurate or more relevant data to complete the data set initially identified in step 2.
Deliverables: Data Exploration This step should produce the initial draft of the following documents:
- Exploratory Data Analysis Report: A document detailing data requirements, quality (accuracy, connectedness) and relevance to the target and the ability to answer the question of interest. It is best to use graphical methods to clearly show data features in an understandable way. Additionally, we should have an idea if there enough data to answer the question of interest with some confidence in the end result.
- Analytics Architecture Diagram (initial draft): With the data sources in hand, we can start to define how the machine learning pipeline will work? How often will the data sources be updated? What actions should be taken on those updates? Is there a retraining criteria as we collect and label new observations? Documenting this now can help us define and capture the required artifacts for use in later steps.
Checkpoint Decision
Before we begin to do the full feature engineering and model building process, we can reevaluate the project to determine value in continuing this effort. We may be ready to proceed, need to collect more data, or it's possible the data does not exist to answer the question.
4. Construction of Analysis Data
Goal: Construct the analysis data set, with associated feature engineering, for building the machine learning model.
Responsibility: Data science team usually made up of data engineers, experts in getting data from disparate sources, and data scientists performing additional quality and quantity checks.
The analysis data set is defined by the following:
- Inclusion/Exclusion criteria: Evaluate observations on multiple levels to determine if they are part of the population of interest. Are they connected in time? Are there observations that are missing large chunks of information? We look at both business reasons and data quality reasons for observation inclusion/exclusion criteria.
- Feature engineering involves inclusion, aggregation and transformation of raw variables to create the features used in the analysis. If we want insight into what is driving the model, then we need to take care in how features are related to each other, and how the machine learning method will be using those features. This is a balancing act of including informative variables without including too many unrelated variables. Informative variables will improve our result; unrelated variables will introduce unnecessary noise into the model.
- Avoid leakage: Leakage is caused by including variables that can perfectly predict the target. These are usually variables that may have been used to detect the target initially. As the target is redefined, these dependencies can be hidden from the original definition. To avoid this often requires iterating between building an analysis data set, and creating a model and evaluating the accuracy. Leakage is a major reason data scientists get nervous when they get really good predictive results.
Deliverable: Feature Engineering
This step produces the following initial draft artifacts:
- The analysis data set itself, which will be used to train and test the machine learning model in the next step.
- A document describing the feature engineering required to construct the analysis data set.
- The source code to build the analysis data set, including queries or other source code to produce the model features and the model targets. The model features should be held separate from the target calculations for use when predicting on new observations in a production setting. This artifact will be directly used in the production pipeline of step 7.
5. Machine Learning Model
Goal: Answer the question by constructing and evaluating an informative model to predict the target.
Responsibility: Data science.
After a large amount of data specific work, we are now ready to start building a model. This machine learning step is often executed in parallel with constructing the analysis data set as information from our model can be used to build better features in the analysis data set.
The process involves:
- Splitting analysis data into training and testing data sources.
- Evaluate (training and testing) a series of competing machine learning methods that are geared toward answering the question of interest with the data we currently have at hand.
- Determine the "best" solution to answer the question by comparing the success metric between alternative methods.
Deliverables: Machine Learning
- The machine learning model which can be used to predict the target for new observations. This artifact will be directly used in the production pipeline of step 7.
- A document describing the model, how to use the model and findings from the modelling process. What do these initial results look like? What do these tell us about our hypotheses and about the data we are using? Additionally, we can define visualizations of the model results here.
Checkpoint Decision
Again, we can reevaluate if moving on to a production system here. Does the model answer the question sufficiently given the test data? Should we go back and collect more data (step 2) or change how the data is being used (step 4)?
6. Validation and Customer Acceptance
Goal: To finalize the machine learning deliverable by confirming the model and the evidence for the model acceptance.
Responsibility: Customer focused evaluation of the project artifacts.
In order to get to this point, the data science team has some confidence that the project has progressed in answering the question of interest. The answer may not be perfect, but given the data sources, data exploration, the analysis data set, and the machine learning model, the data science team has some estimates of the ability and accuracy of the model attaining the project objective.
This step formalizes the delivery of the engagement artifacts and results to the customer for final review before committing to building out the production pipeline. The customer can then determine if the model meets the success metrics and whether the production pipeline would add business value.
Deliverable:
The following finalized documents and artifacts from each of the project milestones:
- Project Objective (step 1)
- Data Sources (step 2)
- Data Exploration (step 3)
- Feature Engineering (step 4).
- Machine Learning (step 5)
Checkpoint Decision
For the most part, the customer should be familiar with all of these deliverables, and be aware of the current state of the project throughout the process. The validation and customer acceptance step gives the customer a change to evaluate the validity and value of the data science solution from a business perspective, before committing to continue with the production implementation.
7. Production Pipeline Implementation
Goal: Implement the full process to use the model and insights obtained from the engagement. The pipeline is the actual delivery of the business value to the customer.
Responsibility: The data science team, typically data engineers building out the system described initially in the initial data exploration step.
Deliverable: The deliverable here is defined by how the customer intends on using the results of this engagement. This could and should include delivery of actionable insights obtained throughout the engagement. These insights can be delivered through:
- Data and machine learning visualizations.
- Operationalized data/machine learning pipeline to predict outcomes on new observations as they become available.
Conclusion
We have presented a generalization of a series of formalized data science project methodologies that we have found useful in our customer engagements. We have avoided adding time estimates to this document as they will be very dependent on specific resources available. In our work, we have built a full project plan with the understanding that dates estimates are dependent on a linear progression and will require updates as each milestone is achieved, or revisited.
The goal of this process is to continue to move a data science project forward towards a clear engagement end point. We recognize that data science is a research activity and that progress often entails an approach that moves two steps forward and one step (or worse) backwards. Being able to clearly communicate this to customers can help avoid misunderstanding and frustration for all parties involved, and increase the odds of success.
John (jehrling@microsoft.com) & Basri (badogan@microsoft.com)
References
- U.M. Fayyad, G. Piatetsky-Shapiro, and PSmyth. 1996. "Advances in Knowledge Discovery and Data Mining." American Association for Artificial Intelligence. https://dl.acm.org/citation.cfm?id=257938.257942.
- G. Piatetsky-Shapiro, 2014. "KDNuggets Methodology Poll." In. https://www.kdnuggets.com/polls/2014/analytics-data-mining-data-science-methodology.html.
- S.S. Rohanizadeha, and M.B. Moghadama. 2009. "A Proposed Data Mining Methodology and Its Application to Industrial Procedures." Journal of Industrial Engineering 4: 37–50.
- B. Rohrer, 2016. "How to Do Data Science." In. https://blogs.technet.microsoft.com/machinelearning/2016/03/28/how-to-do-data-science/.
- R. Wirth, 2000. "CRISP-DM: Towards a Standard Process Model for Data Mining." In Proceedings of the Fourth International Conference on the Practical Application of Knowledge Discovery and Data Mining, 29–39.