Cloud-Based Energy Disaggregation Using the Cortana Analytics Suite
This post is authored by Dmitry Pechyony, Senior Data Scientist at Microsoft, and Ilan Reiter, Principal Data Science Manager at Microsoft.
For those of you who have looked at your electricity bill in dismay, wondering what makes your energy consumption so sky high, help may soon be on its way.
The technique of energy disaggregation analyzes the aggregated energy consumption recorded by smart meters and then breaks it down by individual electrical devices in that system. This allows consumers to learn about their energy consumption patterns and change their habits to save energy costs. Done at a macro level, responsible power consumption by millions of consumers can reduce greenhouse gas emissions and decelerate global warming.
The simplest energy disaggregation systems detect power consumption spikes and find the device causing the spike. This is illustrated below:
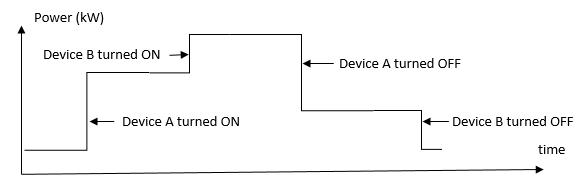
In practice, however, energy consumption graphs are much more complex:
- For many devices there is no clear spike when the device is turned on or off. Instead, energy consumption increases or decreases gradually.
- There are devices with more than two states.
- A device can have varying power consumption in the same state.
- Since there are many devices in a building, there is a probability that several devices will be turned on or off at the same time, and such devices may also have similar power consumption patterns.
All these factors make energy disaggregation a challenging problem.
In this post we describe our approach for building an end-to-end energy disaggregation solution in commercial buildings. The same approach can be applied to other city-scale systems in which there is one aggregated meter, for example water or gas systems.
Much of the current work in energy disaggregation is focused on residential single-family houses. Commercial buildings introduce additional challenges as the number of electrical devices they have is typically at least an order of magnitude larger. Many interesting applications can be built on top of energy disaggregation systems. One common application is an alerting system that checks if an expected state deviates from the norm, indicating device failure. Other applications involve forecasting resources, such as predicting device usage (e.g. an electric vehicle charger) and overall expected load. Once an energy disaggregation system is able to predict when a device is in use, we can provide information on which devices will be available at a given time. For instance, an app can show the status of electric vehicle chargers in a parking lot, or that of washing machines and dryers in a laundromat.
Energy disaggregation efforts have a long history of academic research and development, starting in the 1980’s at MIT. Until about a decade ago, this required expensive hardware, but with the advent of smart meters (often installed free-of-charge by utility companies), energy disaggregation has become more accessible. According to U.S. Energy Information Administration, by the end of 2013 there were more than 51 million smart power meters installed in the United States. Outside the US, China was expected to have 500 million smart meters installed by the end of 2015. Modern smart meters are able to store power consumption data in a real-time data infrastructure such as the PI System from OSIsoft. What’s more, constantly improving network and storage capabilities make it feasible to record measurements at very high resolution. This creates a huge opportunity for data scientists – they can bring what was formerly academic research to the masses, with solutions that analyze power consumption data and use disaggregated data to help reduce future energy consumption and provide other benefits such as forecasting, alarms and more.
Microsoft is working with OSIsoft and the utilities department at the University of California, Davis, to build a large-scale system for energy disaggregation in commercial buildings. The disaggregation system is hosted in the Microsoft Azure cloud and gets real-time and historical data from smart meters using the OSIsoft PI System. UC Davis is using the system to disaggregate power consumption in a parking garage on campus. The data from the meter is collected by the PI system at two second resolution. The disaggregation is done daily for every 10 seconds of power consumption throughout the parking structure for the previous day. This high-frequency disaggregation allows UC Davis to catch very short-term events, such as the activation of an elevator. The system disaggregates power consumption for 98 devices and is based on a novel algorithm that predicts both the energy consumption and state of each device. The system generates and stores more than 3 million predictions every day.
One of the main components of energy disaggregation systems is a power consumption profile for each individual connected device. We build energy consumption profiles in a supervised way. Initially the system is trained to recognize power consumption from each device. For this purpose, for each device we solve a non-negative matrix factorization problem using the SPAMS package in R. At scoring time, we solve a quadratic optimization problem at each time point to find energy consumption for each individual device.
The end-to-end operationalized pipeline consists of several components of the Cortana Analytics Suite, including the Azure ML web service, Azure Data Factory, Azure SQL Database and Azure Storage. The web service uses both native modules of Azure ML as well as ad-hoc data processing implemented in R. The data from various sensors in the UC Davis campus is collected in OSIsoft’s PI system using many available PI Connectors. Our sensor of interest is a high-resolution ION 7350 smart meter in a parking garage. By using OSIsoft’s PI Integrator framework, data from this sensor is rapidly interpolated and pushed to Azure SQL DB so that it can be consumed by the Cortana Analytics Suite of products. The predictive results of this energy model are stored back in the on-premises PI System and may be used by building management systems.
The diagram below illustrates our system architecture:
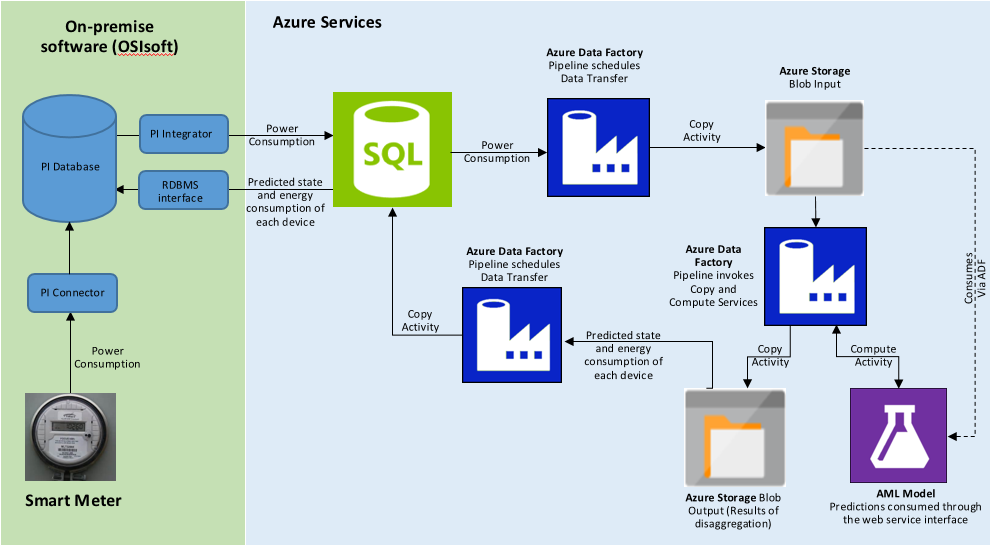
Building an accurate large-scale energy disaggregation system such as this one is a significant effort and requires close interaction between data scientists and domain experts. Fortunately, by using managed Azure services from Cortana Analytics Suite and the data capabilities of the PI System infrastructure, we were able to accelerate the development of our system and also reduced our associated IT costs.
Dmitry & Ilan