Virtual Machine Manager and Performance Metrics (CPU counters) - Part 1
Chetan from my team volunteered to write a two part blog post about how VMM gathers the performance information it shows on VM.
This article describes the details around the performance metrics that VMM collects and how to make sense of perf information that is displayed in VMM.
VMM uses a periodically running performance refresher that gathers performance data from its Hosts & VMs and stores it in the database to be used by the Intelligent Placement feature (this is the nifty star rating prioritization of hosts that you see when you try to migrate a VM or when you try to create a new VM). Besides placement, the UI (VMM Administrator Console) also displays this performance data. This refresh happens every 9 minutes by default and can also be triggered as a side effect of certain VMM actions, which I will explain later. With every refresh, VMM gets the average of every metric over the past 9 minutes. Here is how it’s done on different platforms-
Hyper-V – Hyper-V hosts expose certain performance counters (https://blogs.msdn.com/tvoellm/archive/2008/05/04/hyper-v-performance-counters-part-one-of-many.aspx) for that physical host and the virtual machines residing on it. VMM Server talks to each Hyper-V host over WSMAN to gather these performance metrics for that host and its VMs. VMM collects virtual machines performance metrics directly from its host because of some limitations (https://blogs.msdn.com/tvoellm/archive/2008/03/20/hyper-v-clocks-lie.aspx) of what a virtual machine understands about its true performance. Here a few interesting metrics explained --
1- Host CPU Average exposed in VMM console is “%Total Run Time” counter of “Hyper-V Hypervisor Logical Processors(_Total)” counter set*** averaged over past 9 minutes . This counter captures processor utilization being caused on the host (parent partition) and by the VMs. This value and other host perf metrics could be refreshed on demand as part of Refresh-VMHost or Refresh action for Hosts in VMM Console. Note that this value is different from the Host’s Task Manager or %Processor Time(_Total) counter would show, which only consider the parent partition utilization.
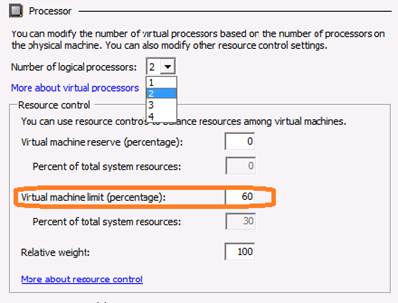
2- VM CPU Average exposed in VMM console is “%Guest Run Time” counter of “Hyper-V Hypervisor Virtual Processor(_Total)” counter set . This is the percentage of time spent by the virtual processor(s) to run the VM. Since Hyper-V allows controlling how many processors and what percent of their capacity that can be assigned to run a VM, the Guest Run Time counter value can never exceed that limit (see image below). Note that this is very different from the VM CPU% displayed in HyperV console, which is CPU utilization caused by the VM in terms of Host Logical Processors.
For example- The HyperV VM settings shown in the image below, has been intentionally allotted 60% of 2 processors capacity. So if this VMs utilization is at 100% from inside the guest, this VM is actually using 60% of the 2 virtual processors assigned to it. VMM console would show ~60% in this case, HyperV console will show ~30% for this VM. Now you will wonder why Hyper-V displays 30% and VMM displays 60%. The 60% of the 2 Logical Processors assigned to the VM is 30% of the total system resources. It turns out that the physical Hyper-V computer has 4 logical processors. Thus 60% of 2 LPs assigned to the VM is 30% of the 4 LPs that Hyper-V has. One other important thing to note is that the 60% that VMM will potentially show is averaged/tiered over the last 9 minutes, and it is not an instant value for a point in time CPU percentage of a VM.
***= All counter sets on a computer can be seen using Performance Monitor(perfmon.exe).

VMware – VMM talks to Virtual Center API server to get performance metrics for all its Hosts and their VMs.