Email Reaction Time in Dynamics 365 for Marketing - First Look
If you (like I) opted in for the Early Access to the April Release you can already now take a peak into some of the upcoming features, eg "email reaction time" - a new feature to display how quickly a contact reacts to messages arriving at different times.
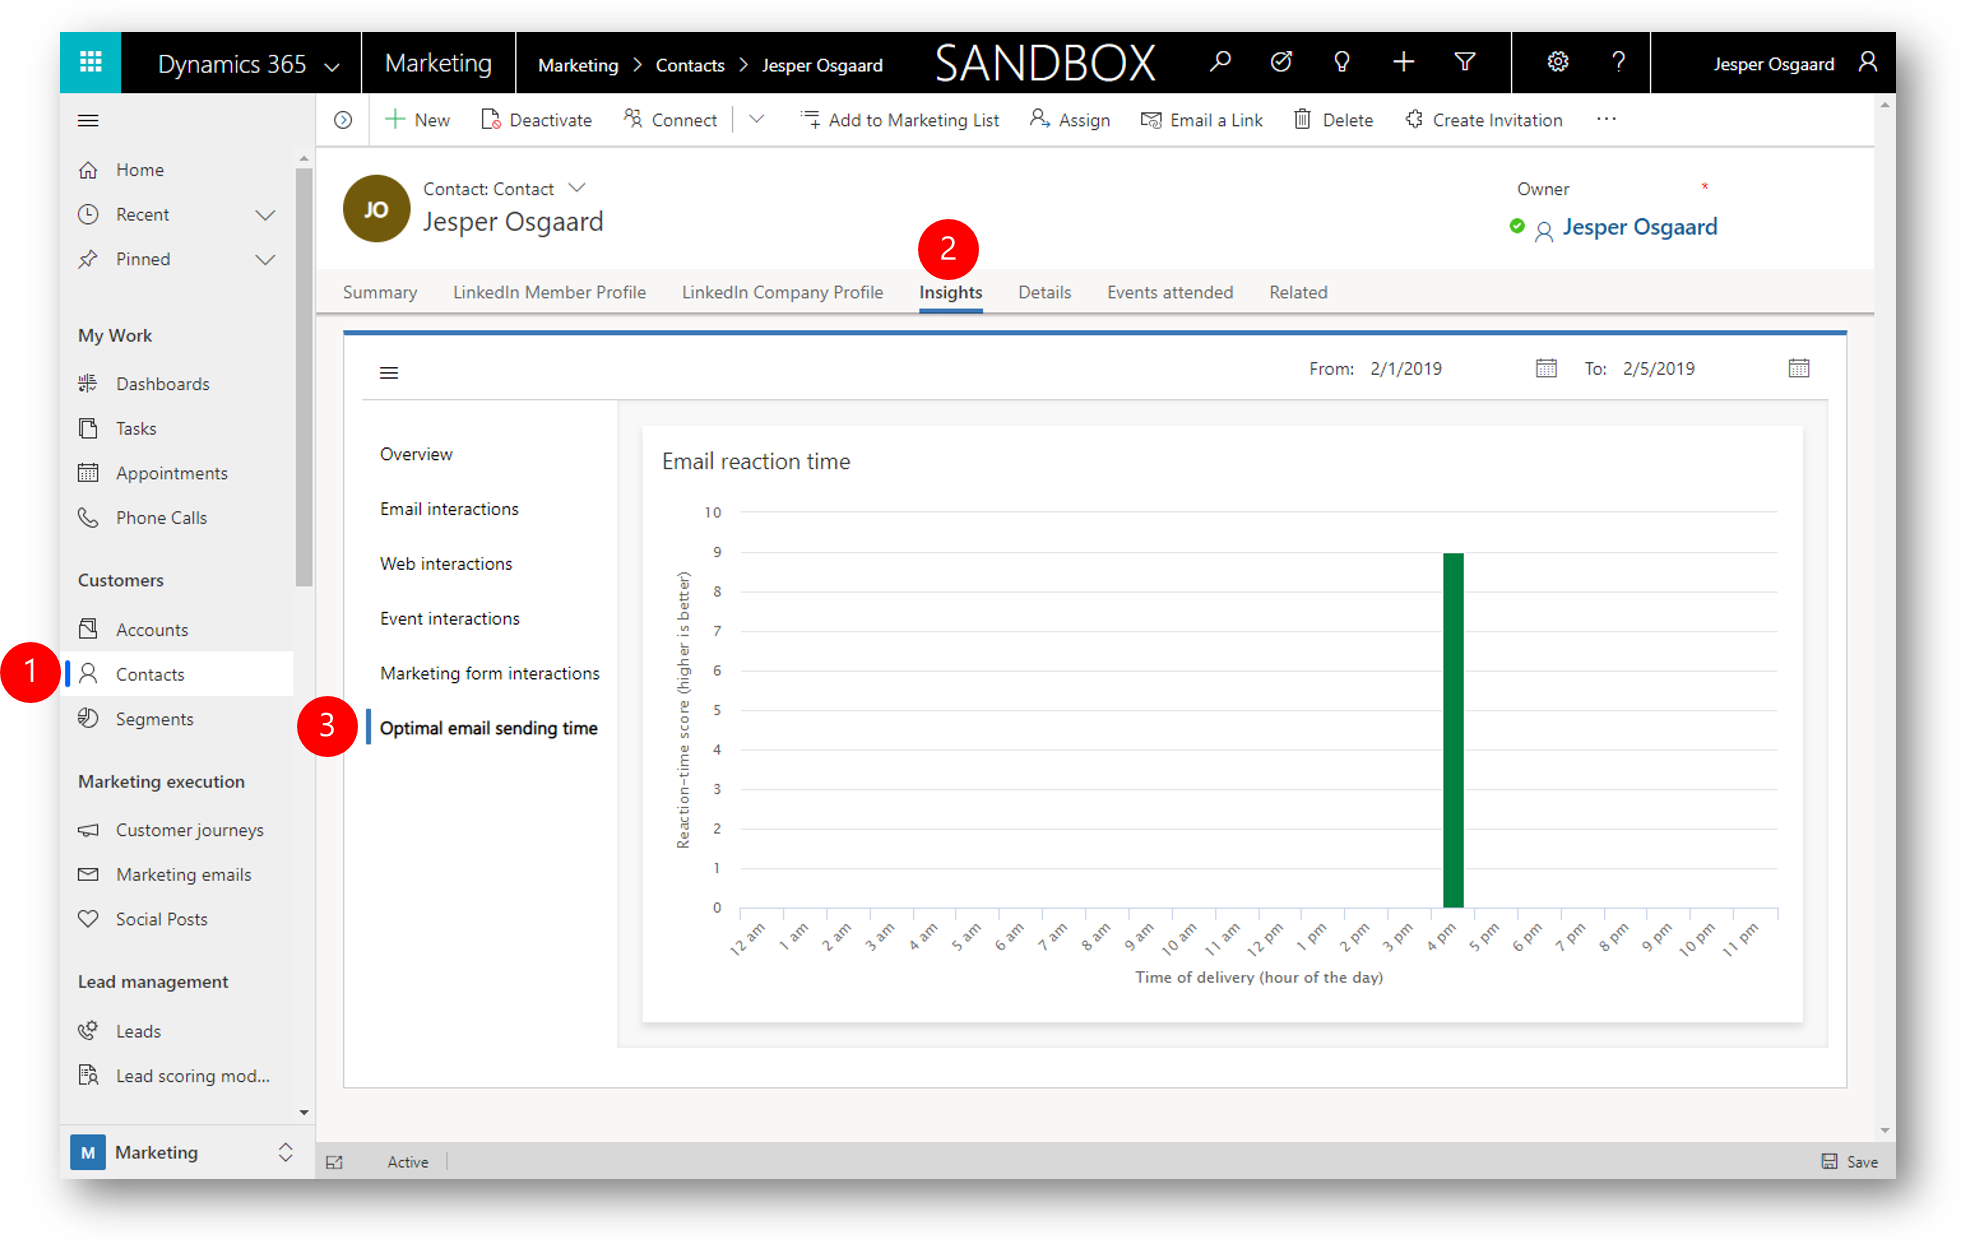
Simply navigate to a contact who recieved an email in one of your customer journeys (1), click the Insights tab (2) and then click Optimal Sending Time (3) to display a bar chart "Email reaction time"
Understanding the "Email reaction time" bar chart
- The horisontal axis is "Time of delivery (hour of the day)" - the time of day the mail(s) was delivered
- The vertical axis is "Reaction-time score (higher is better)" - the reaction score for the delivery times (average, if more than one mail)
- The bar(s) are the average reaction score for each delivery time - a high score indicates a fast reaction time.
In the above example the contact Jesper Osgaard received an email around 4PM and was pretty fast to open the email. This helps you understand when to send emails to this contact.