Understanding the new UI in Microsoft Social Engagement
Microsoft Social Listening is changing its name to Microsoft Social Engagement (MSE), and with the name change comes amongst other things a significant change to the UI too (a redesigned layout).
Disclaimer: By the time of writing this blog post MSE is in Preview, so please consider the below as 'what's to be expected'
When you sign in to MSE you'll be presented with a new dashboard "Analytics", making it easier for you to analyze your data.
The "Analytics" dashboard helps you analyze social data and displays widgets based on the posts resulting from your search topics. A widget is a self-contained unit providing a unique visualization of a pre-defined set of dimensions and metrics for the given data set. Every page in the MSE Analytics page consists of several widgets distributed across the sections of the page.
Widgets display the analysis in easy to understand formats such as bar charts, simple curves, or percentages. You can further filter the displayed data (eg by clicking the widgets) to perform more detailed and focused analysis.
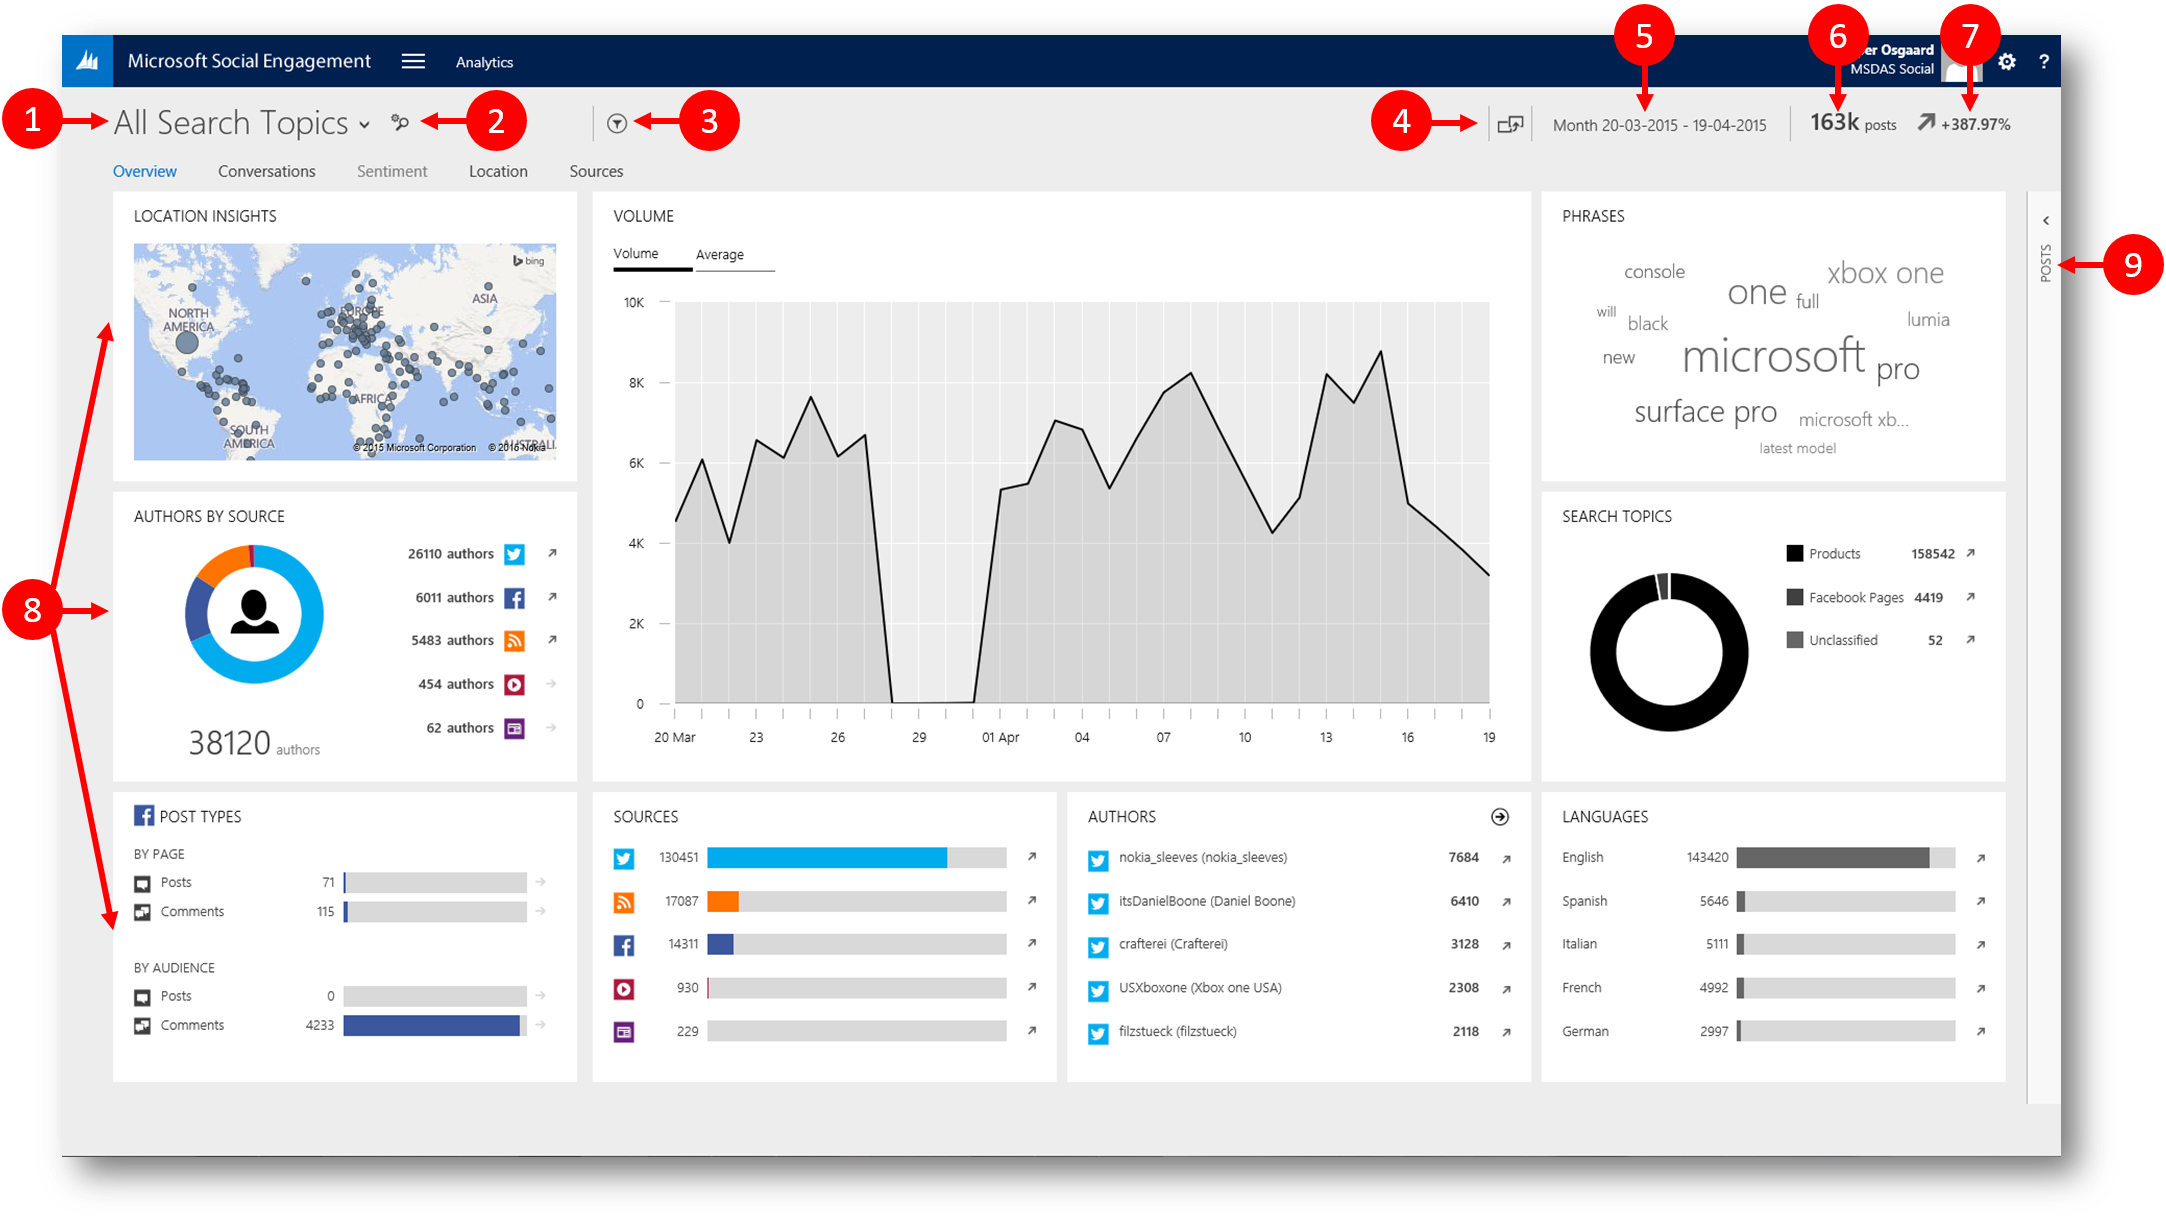
The top part of the page offers various setup and navigation options.

With reference to the bullets in the above graphics:
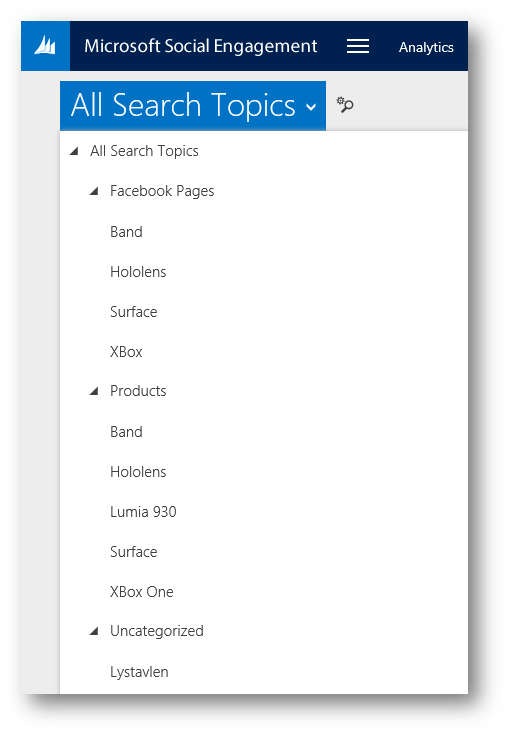
- Analysis focus: Click the down arrow to filter by Search Topic or Category
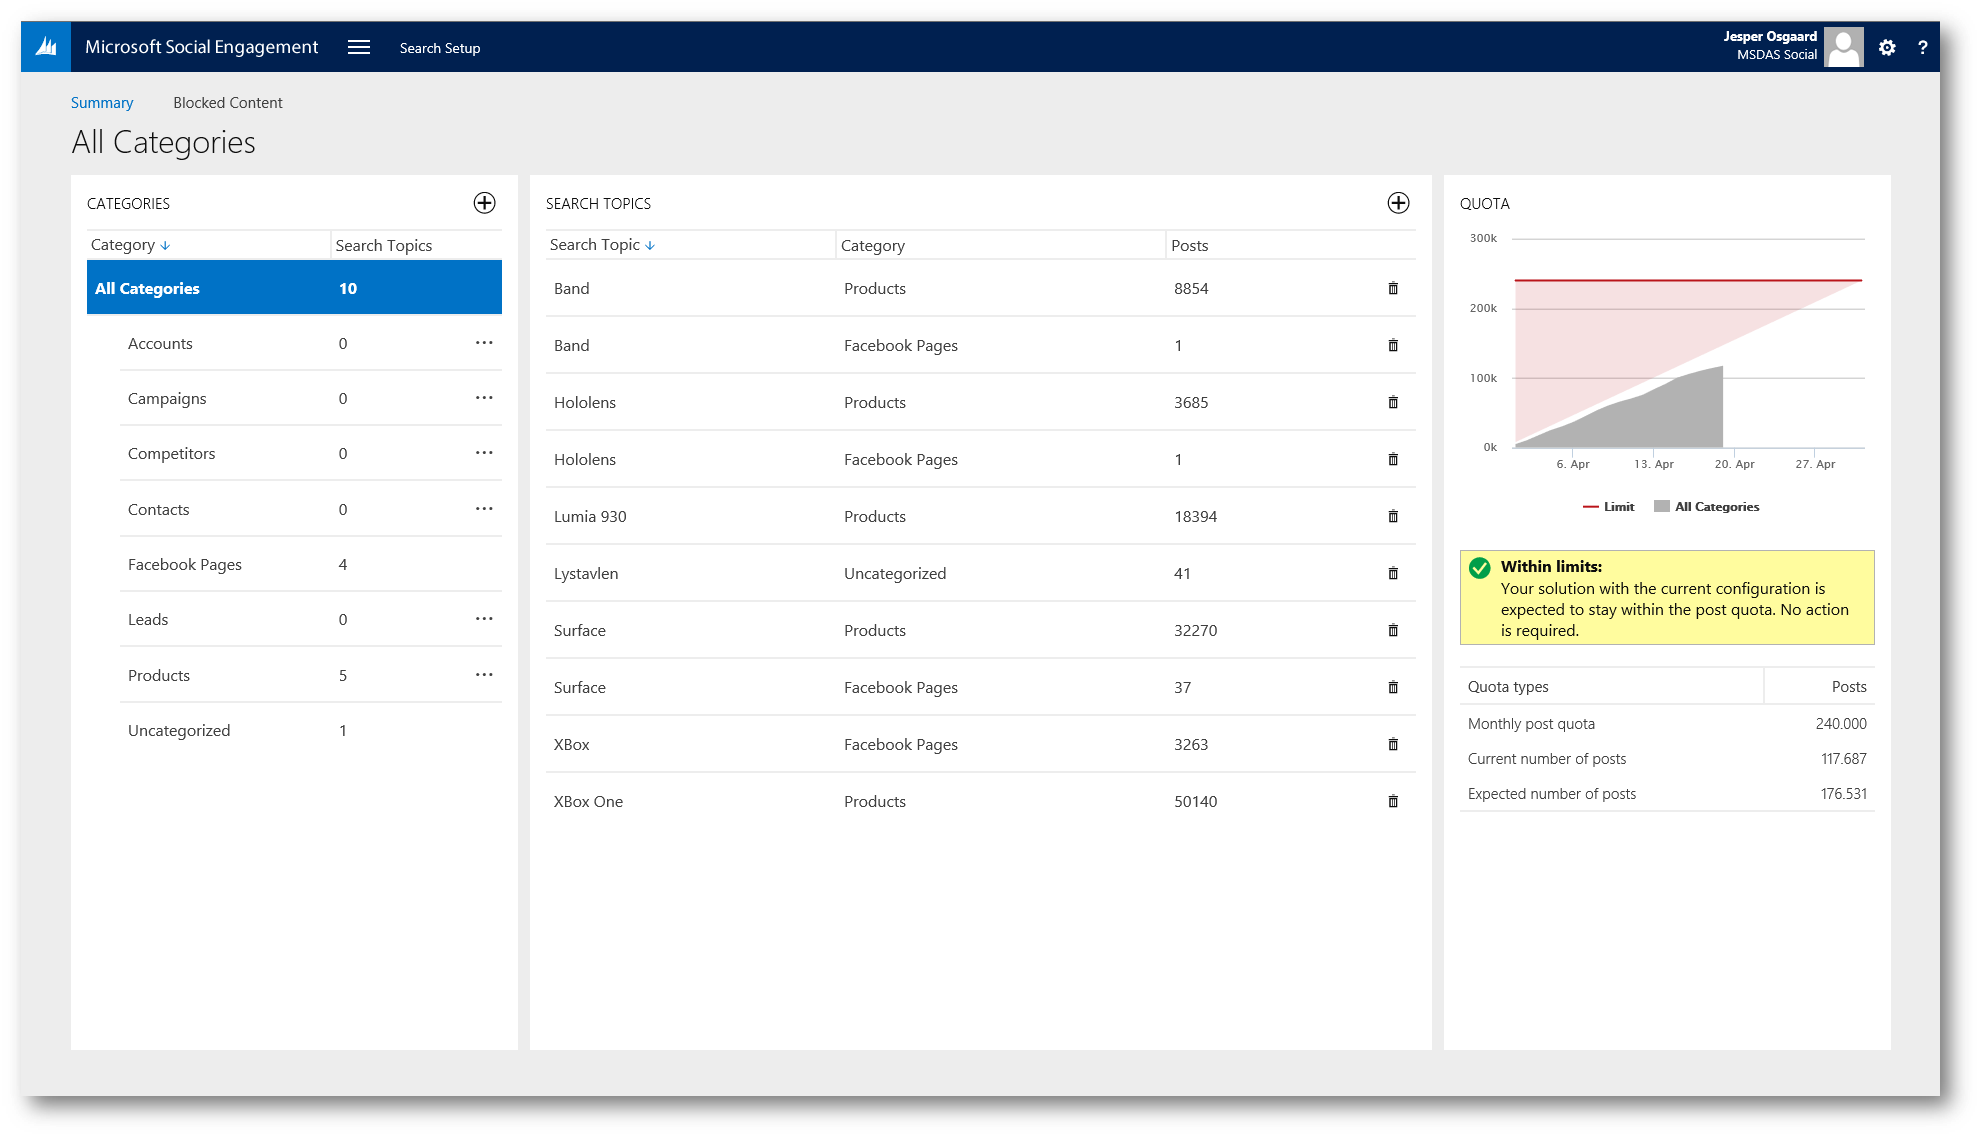
- Click this icon to go the Search Topic setup page
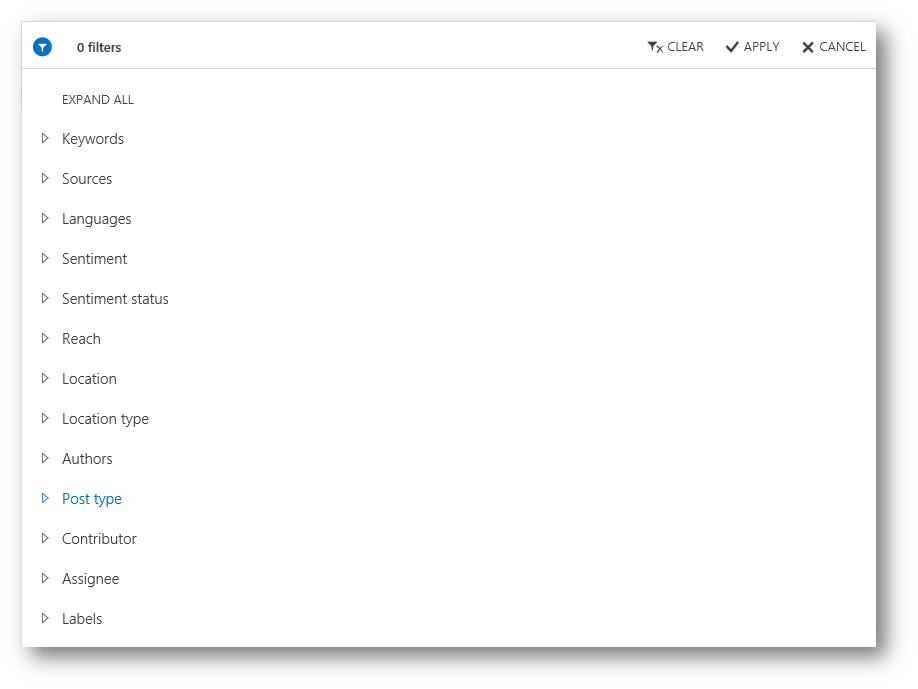
- Click this icon to set filters (13 filters in all - six new; authors, post type, contributor, assignee, and labels). See more later.
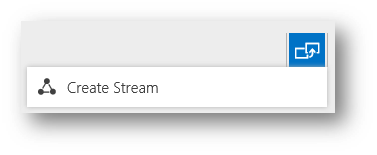
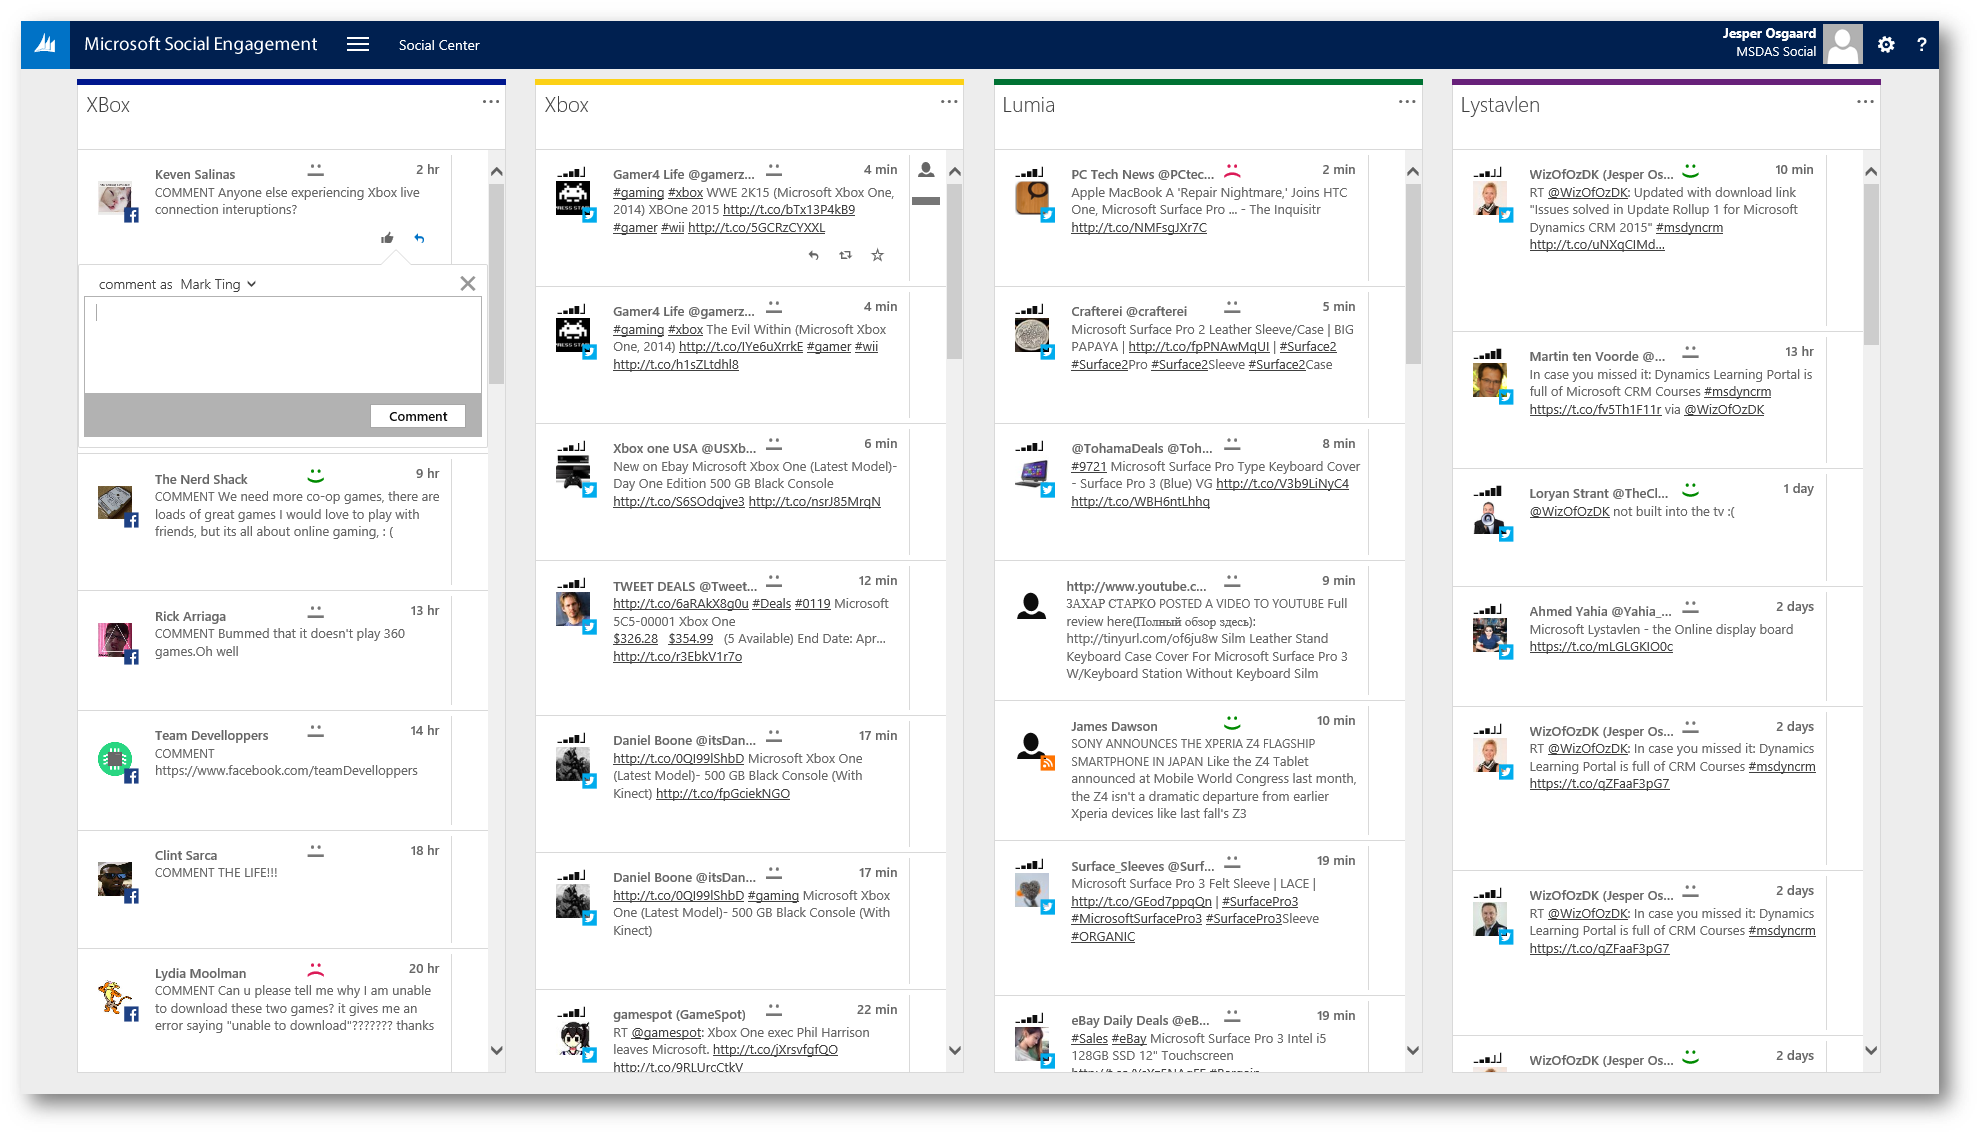
- More options with current filters - eg "Create Stream" (a Stream is a list of posts in the Social Center of MSE, to which you can reply and more - hence the new name; Engagement)
- Select Timeframe for the analysis (eg. Month)
- See the "Volume of posts" for the selected time frame
- Trend
- These three widgets are dynamic widgets, whereas the other six widgets are static
- Static widgets are consistently displayed on the page,
- Dynamic widgets are displayed if certain conditions are met. These conditions depend on the analytics page and the selected data set.
- Both context sensitive
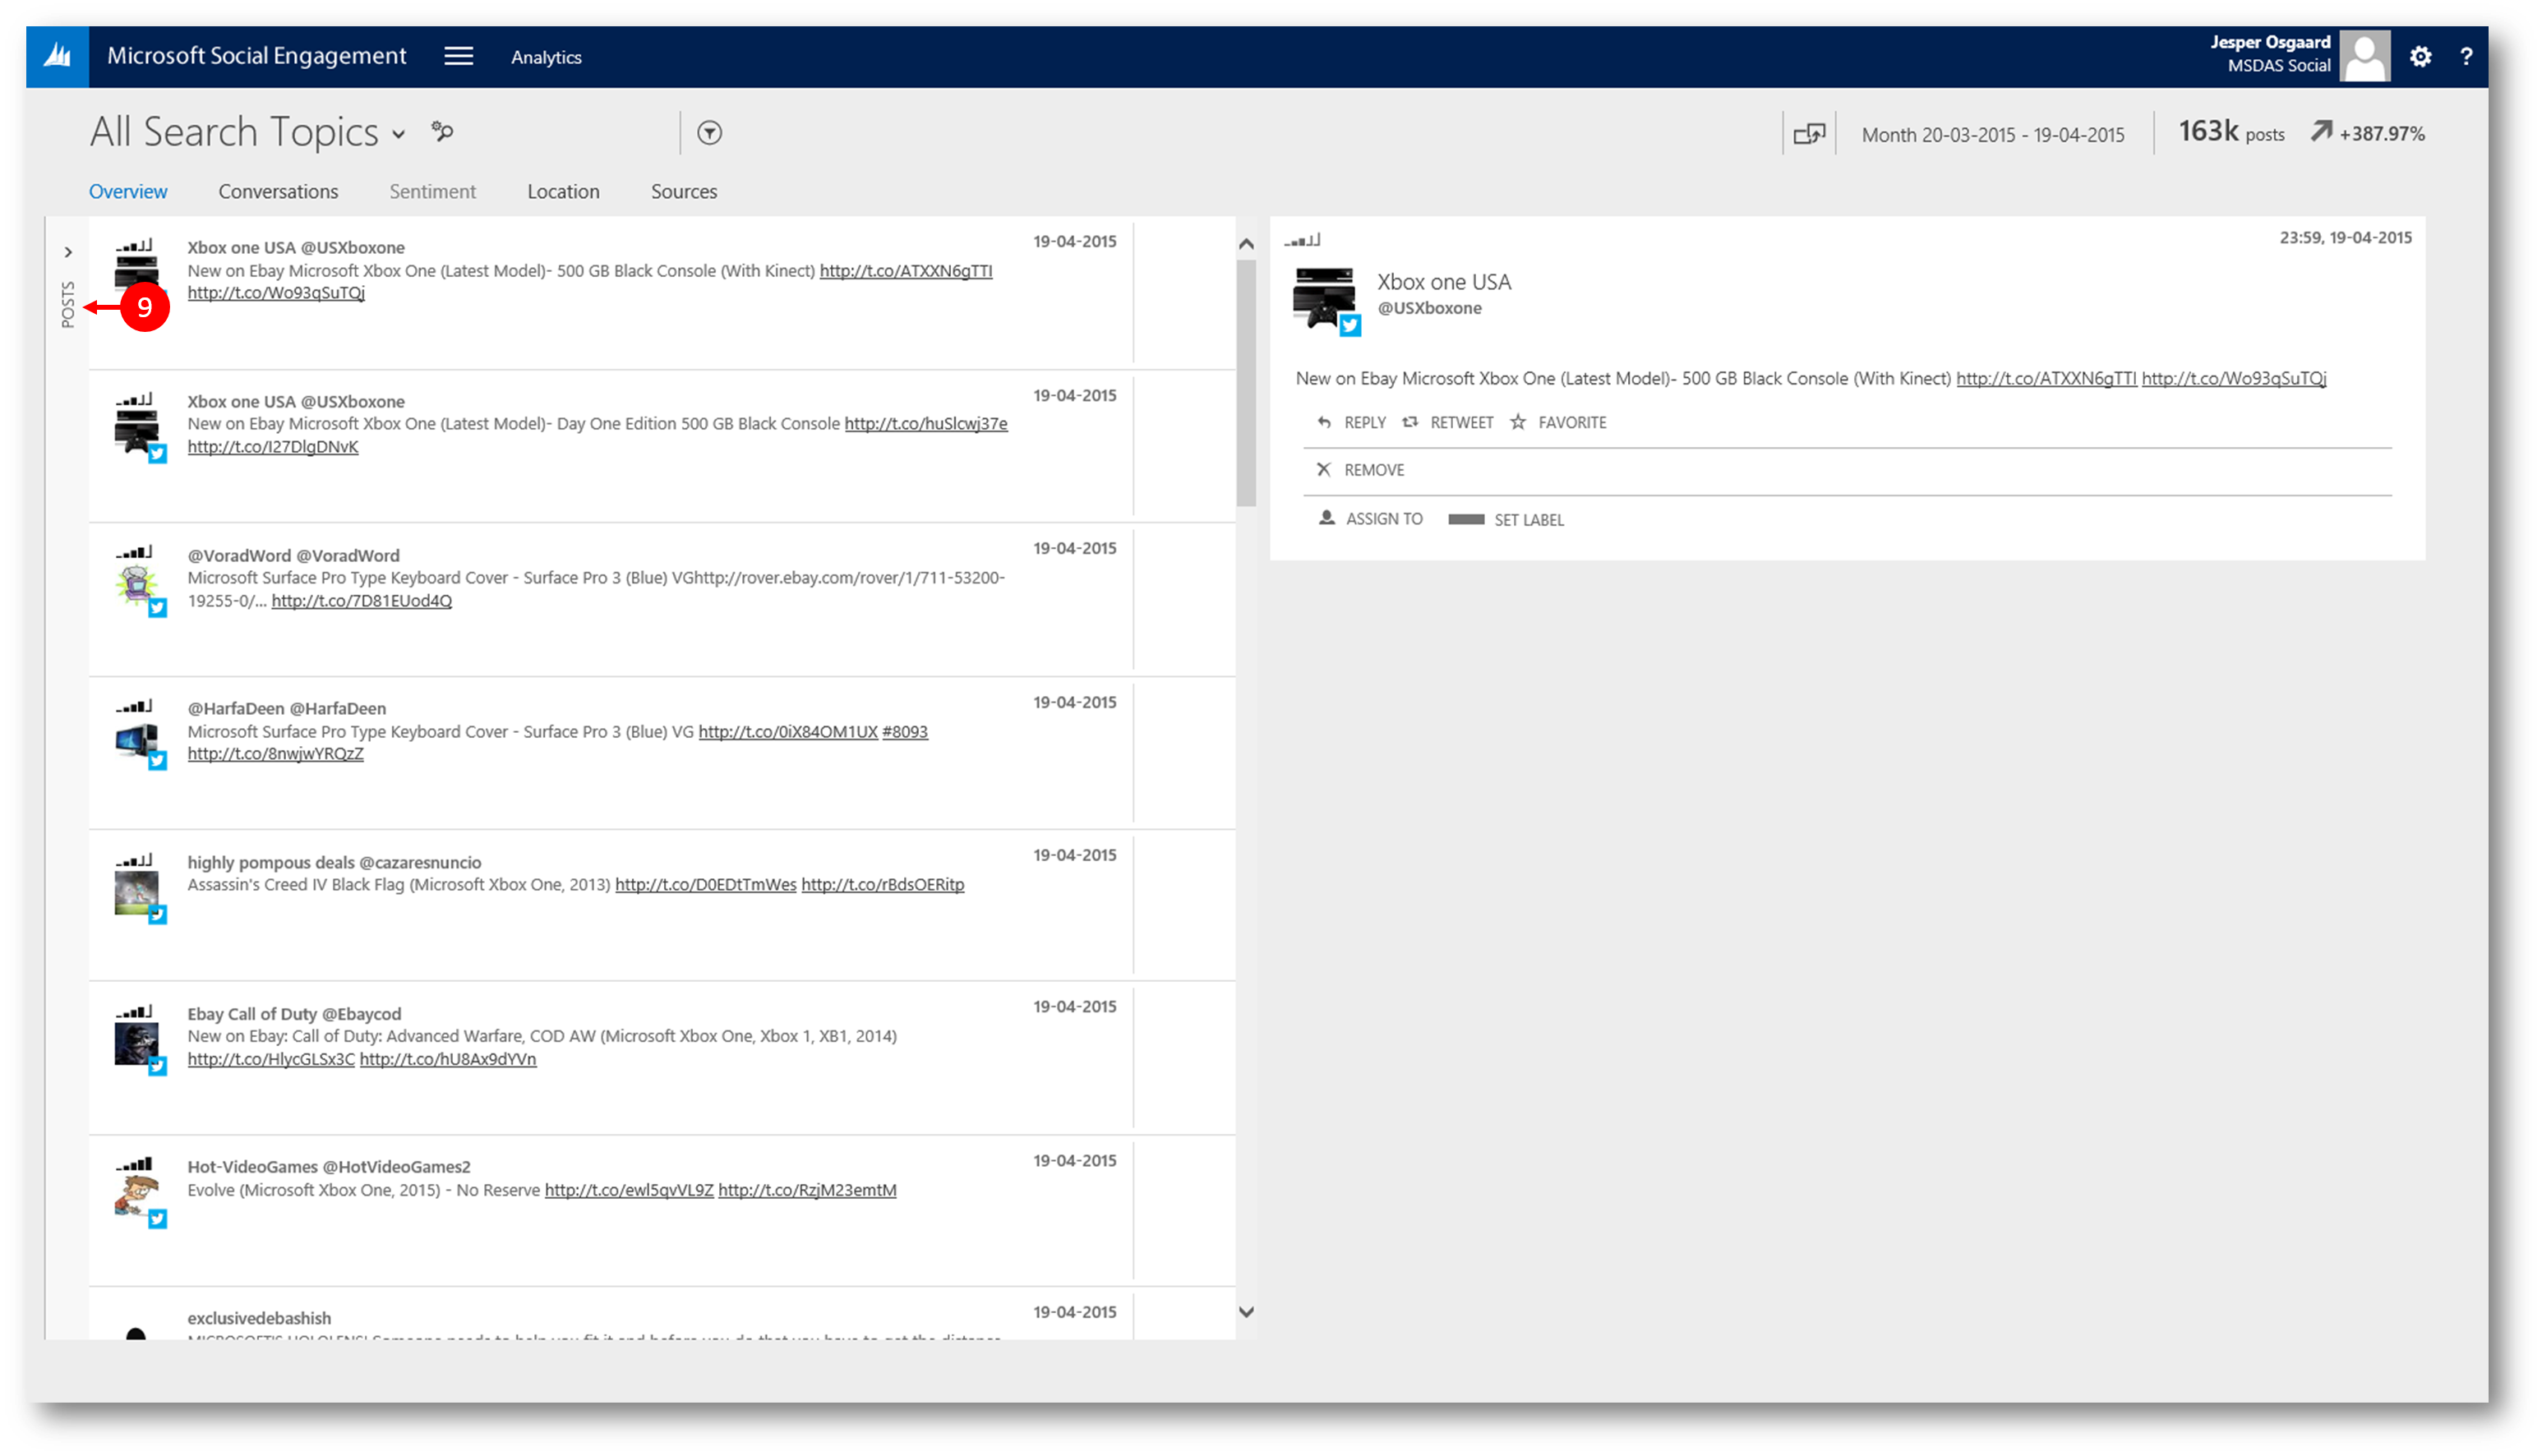
- Click "Posts" to navigate to the post view on any view (and click posts again (9) to return to the previous view)
Filters
Use powerful filters to slice and dice your data and use it in different areas of MSE. Newly added filters (such as the "Labels" filter and "Post type" filter) put even more power in your hands to define the data you want to see. Filters let you narrow your view of the data to a more restricted data set. If you navigate the application by drilling down into the data, filters are applied and removed automatically.
Currently supported filters
You can edit or remove filters from your analysis at any time - and the charts, lists, and key performance indicators (KPIs) will adapt to your selection. Filters you defined persist on the different pages of "Analytics" and adapt if you drill down into more detailed analysis.
The following filters are available:
Filter |
What you can do |
How this affects your data set |
Keywords |
Add keywords that must appear in posts to make them available for analysis. You can add entire phrases or single terms. If you add a comma-separated list of phrases or terms, the commas are treated as a Boolean OR connector and thus will add multiple keywords filters. Common characters are accepted, as well as the special characters @, #, and $. |
Your analysis narrows your results to posts that contain the keywords you’ve entered in your keyword filter. |
Sources |
Select which sources are active in your current analysis. |
Your analysis shows results from the selected sources only. |
Languages |
Choose from the list of active search languages to focus your analysis on one or more languages. |
Your analysis shows results from the languages you selected in your filter. |
Sentiment |
Filter your posts by sentiment value. Select from positive, negative, and neutral. |
You can select from positive, negative, neutral and unknown. Unknown sentiments are posts in languages that aren’t supported by the sentiment calculation. |
Sentiment status |
Select between system-rated sentiment values and manually edited sentiment values. Distinguish if a sentiment value was calculated by the sentiment algorithm or if it was edited by a user. Confirming or changing a sentiment value for a post is considered a manual edit. Find posts that have a specific label assigned. |
Limit your data set to see only posts with the selected sentiment status. |
Reach |
MSE takes an author’s Klout score into account to determine the potential size of an author’s influence, based on data that the Klout service gathers from various social media networks. MSE maps the author’s Klout score to reach values, which allow segmentation of authors’ reaches for Twitter. Choose a value from 1 to 5, where 1 is the lowest reach and 5 is the highest reach.
|
Your analysis narrows your results to posts coming from authors with the reach you defined in your filter. |
Location |
To filter your data for posts from specific locations, add locations or location groups to this filter. To see the list of available locations, start typing the first letters in the input field. |
Your analysis narrows your results to posts that contain location data and where the location data corresponds with the filter you added. |
Location type |
Choose the type of location data you want to include in your current data set. Select post location, author location, or both. |
Analyze posts that have been published in a certain country or region (post location) or by authors from a certain country or region (author location). If you select both location types in the filter and a post contains both types, it will account for the post location over the author location. If only one location type is selected, the same post will show up in either selection. |
Authors |
Filter posts by author names. Any author name is available for filtering, if at least one post was published by the author. Start typing the author name in the input field to see suggested author names from your solution’s database. Choose at the top right to expand the widget to full view mode and see more details about the authors and their posts such as location, trend, language, volume, and time lines. You can also delete an author from here. Caution
|
When you filter by author, only posts from the selected authors remain in your data set and widgets’ display. When you delete an author, the selected author and all the posts for this author gets deleted permanently, you cannot retrieve them. No further acquisition of posts for this author. |
Post type |
Select from "Post", "Reply", "Share", or "Private message" |
|
Contributor |
Choose to see posts from Facebook pages that were either published by the owner of a Facebook page, or from other people posting on this Facebook page. |
Narrow your data set to see which posts are coming from the owner of a Facebook page or the audience of this Facebook page. |
Assignee |
You can enter any user that is assigned a role in Microsoft Social Engagement. Start typing a name to see suggestions. |
Narrow your data set to see only posts that are assigned to the selected user. |
Labels |
Find posts that have a specific label assigned. Any label that an Administrator defined in Settings > Solution Defaults is available as a filter dimension. |
Narrow your data set to see only posts that are assigned to the selected user. |
The five pages of the Analytics dashboard
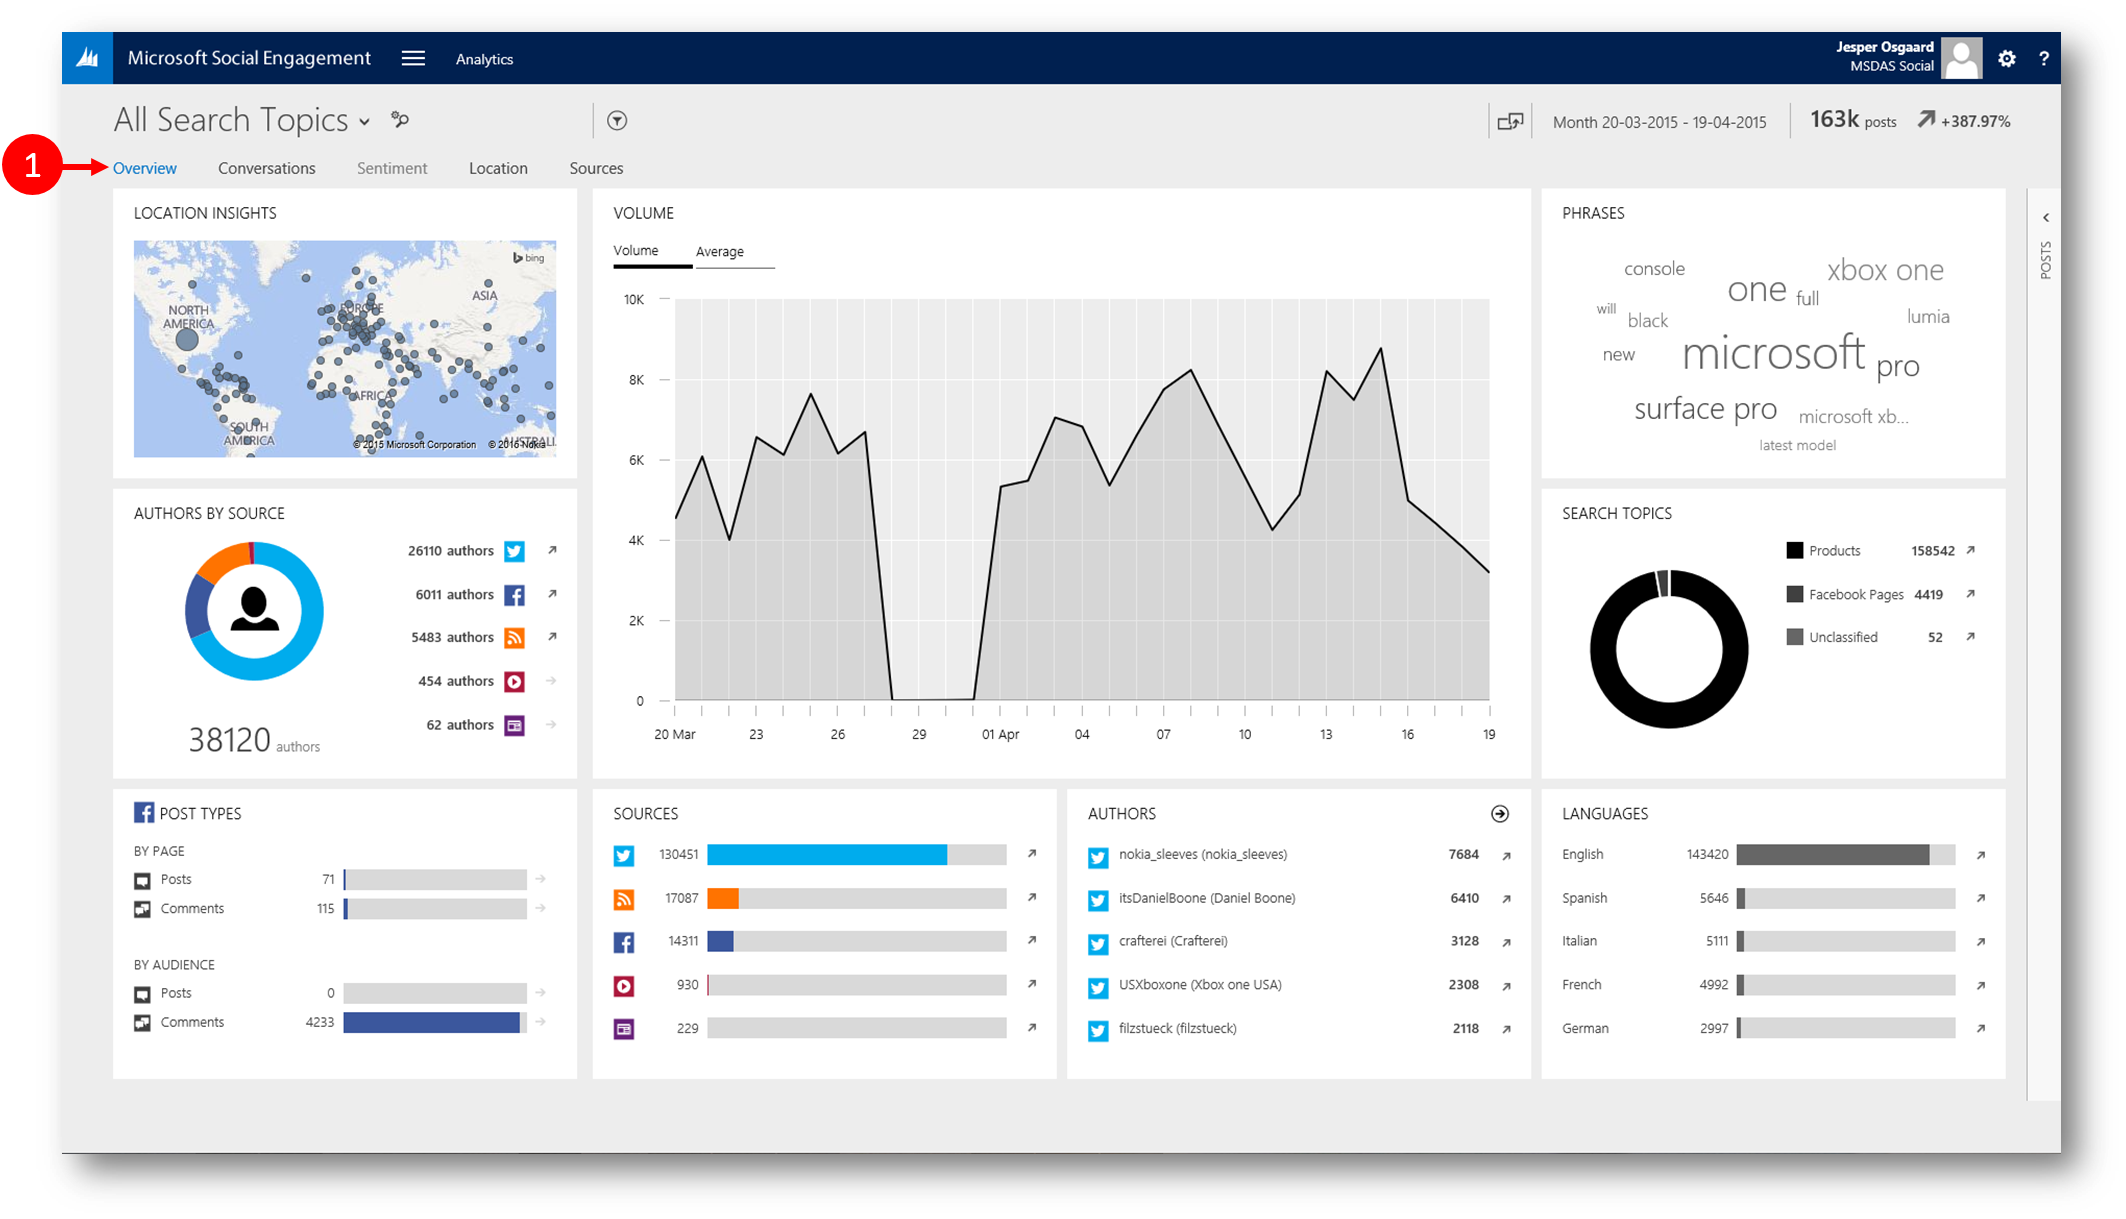
On the Analytics dashboard you can analyse data in depth using five pages (1);
- "Overview" - high-level analytics across all key dimensions. This is essentially the ‘start’ page for the MSE Analytics application
- "Conversations" - detailed content analytics based on the actual content of the social posts
- "Sentiment" - detailed sentiment analytics based on the text analysis of social posts using Natural Language Processing techniques
- "Location" - detailed analytics based on the Geo info contained in the social posts and/or in the authors’ profiles
- "Sources" - detailed analytics based on the social media channels the social posts are coming from
For the rest of this blog post I'll walk you through the widgets you'll see on those pages - what data they display on what metrics they use
Since the "Sentiment" page does not display information if the analytics focus is set to "All Search Topics", I'll apply the search topic "Xbox One" - allowing me to understand all about that product
x
The "Overview" Page
The widgets on the "Overview" page provide information about the volume of posts, sources and location where these posts are coming from, topics discussed, languages used, and the details of influencing authors.
Static widgets on the "Overview" page
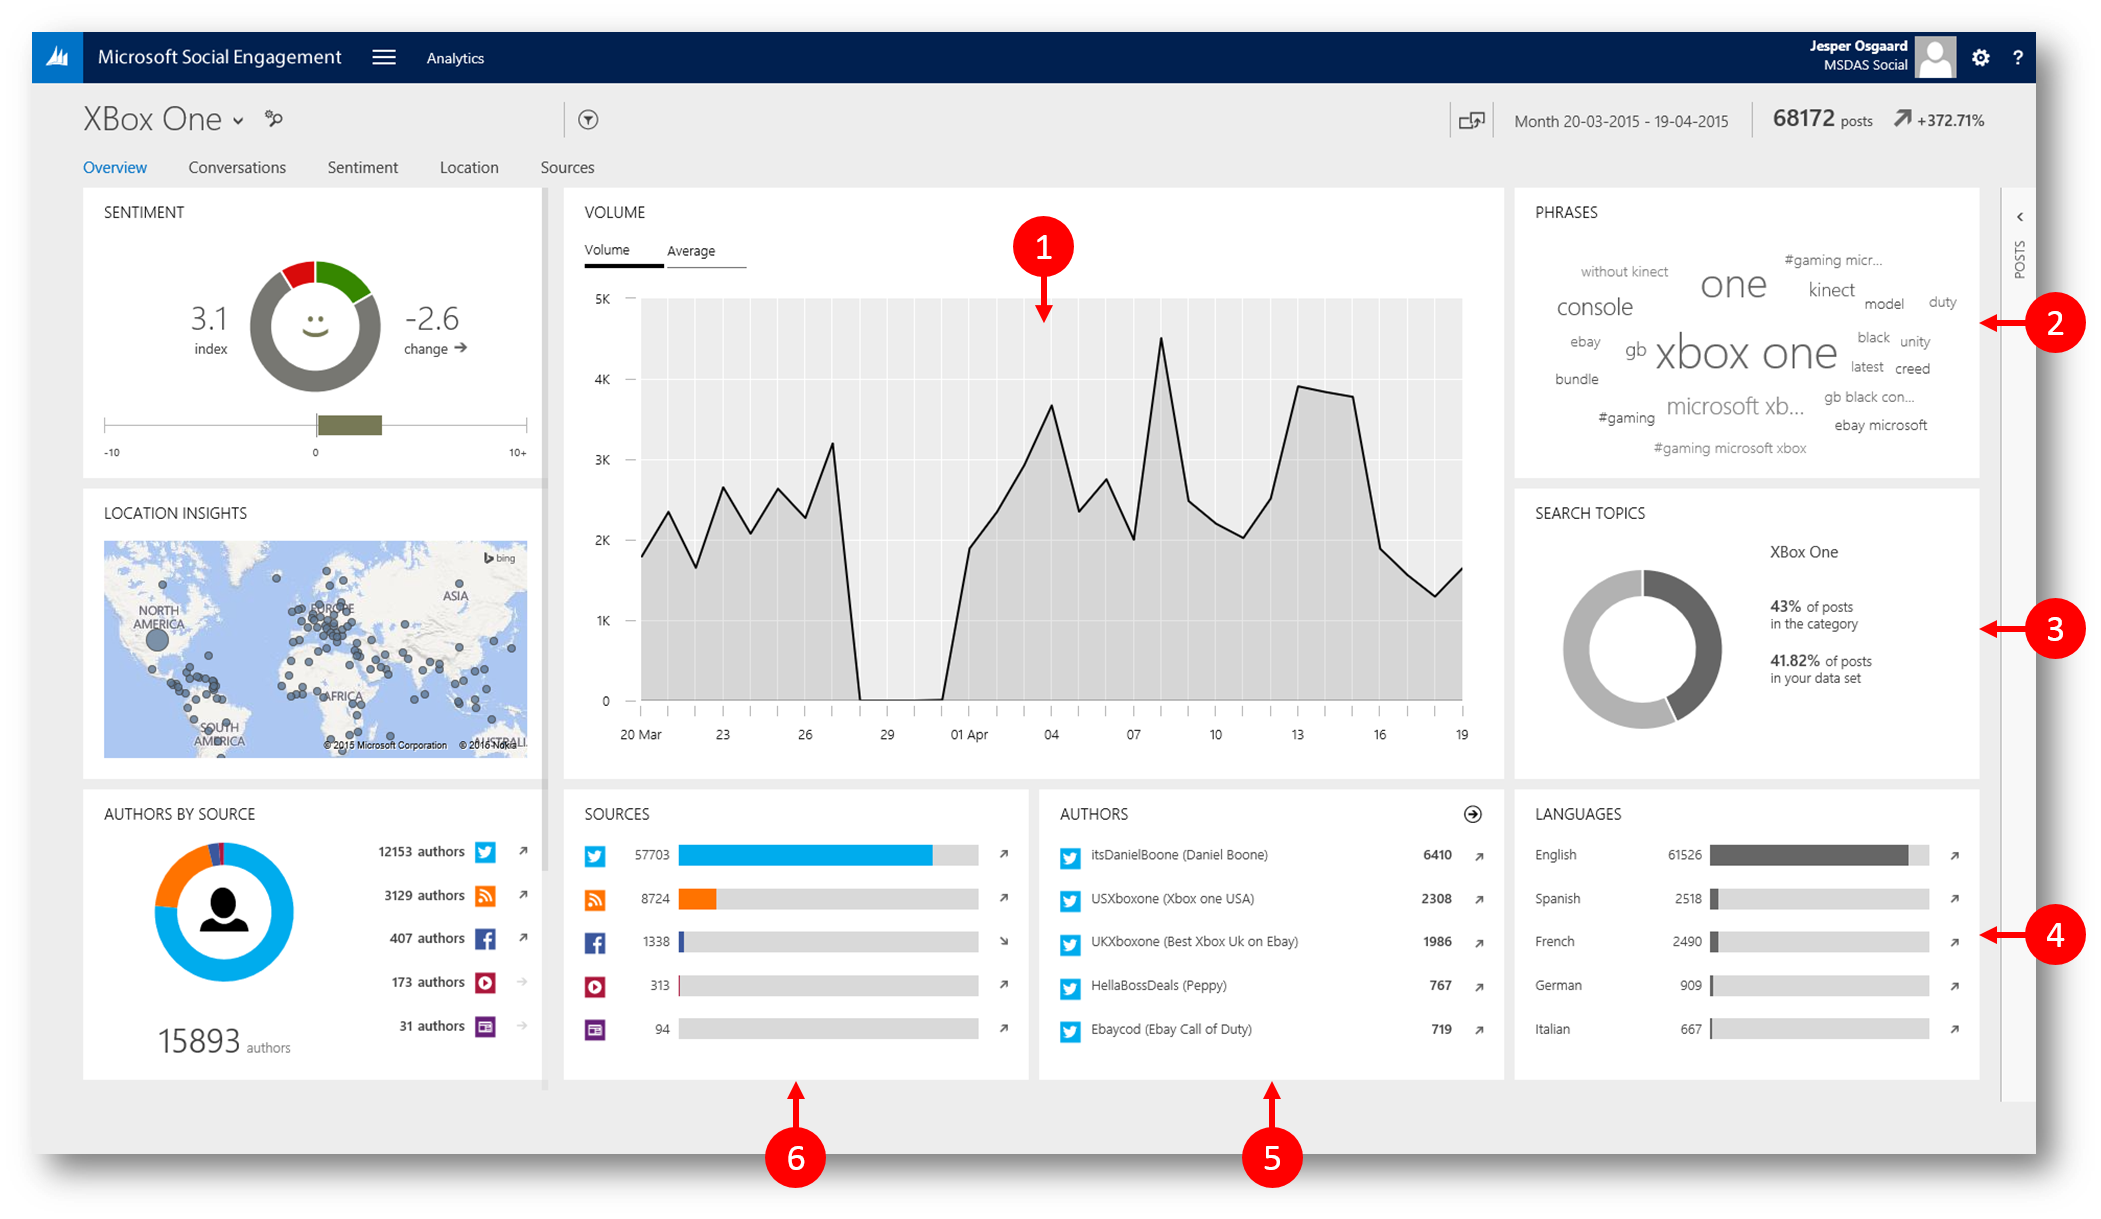
- "Volume"
- Displays: Volume of posts for a selected time frame (Options: Today, Last week, Last month, or custom time frame)
- Metrics: Volume of posts / Average volume of posts / Details of any unavailable data for the selected timeframe
- "Phrases"
- Displays:Most often mentioned phrases, based on the posts of your current data set
- Metrics: Volume of posts
- "Search Topics"
- Displays:Top five categories or search topics, based on the volume of the posts
- Metrics: Volume of posts / Relative volume within the current data set / Trend options: All search topics, topics, categories
- "Languages"
- Displays:The list of five most found languages based on the volume of posts
- Metrics: Top five languages by name / Volume of posts using these / Percentage of posts volume when compared with the total volume of the posts in the current data set / Trend
- "Authors"
- Displays:Normal view of this widget displays top five authors and the sources, based on the volume of their posts. Full view mode displays additional details about authors and their posts.
- Metrics in Normal view: Author name and profile picture (if available) / Source from where the author has posted / Trend value for the authors
- Metrics in Full view (click button top right of widget to switch to Full view): Author name and profile picture (if available) / Source / Number of posts / Trend / Sentiment / Reach / Location / Language / Timeline when the latest post was posted
- "Sources"
- Displays:Top five sources, based on the volume of the posts
- Metrics: Top sources icons / Volume of posts / Percentage of volume as compared with the total volume in the current data sets / Trend
As you can see above we now identify significant phrases in social posts. Content analytics are key to understanding what people are talking about on social media. On the new Conversations page in Analytics (see later) we provide deep insights into the content of the social conversations. We extract important phrases from all social posts in your data set, not just a sample, to provide a clear view into what’s on the minds of your customers and stakeholders on social media
Dynamic widgets on the "Overview" page
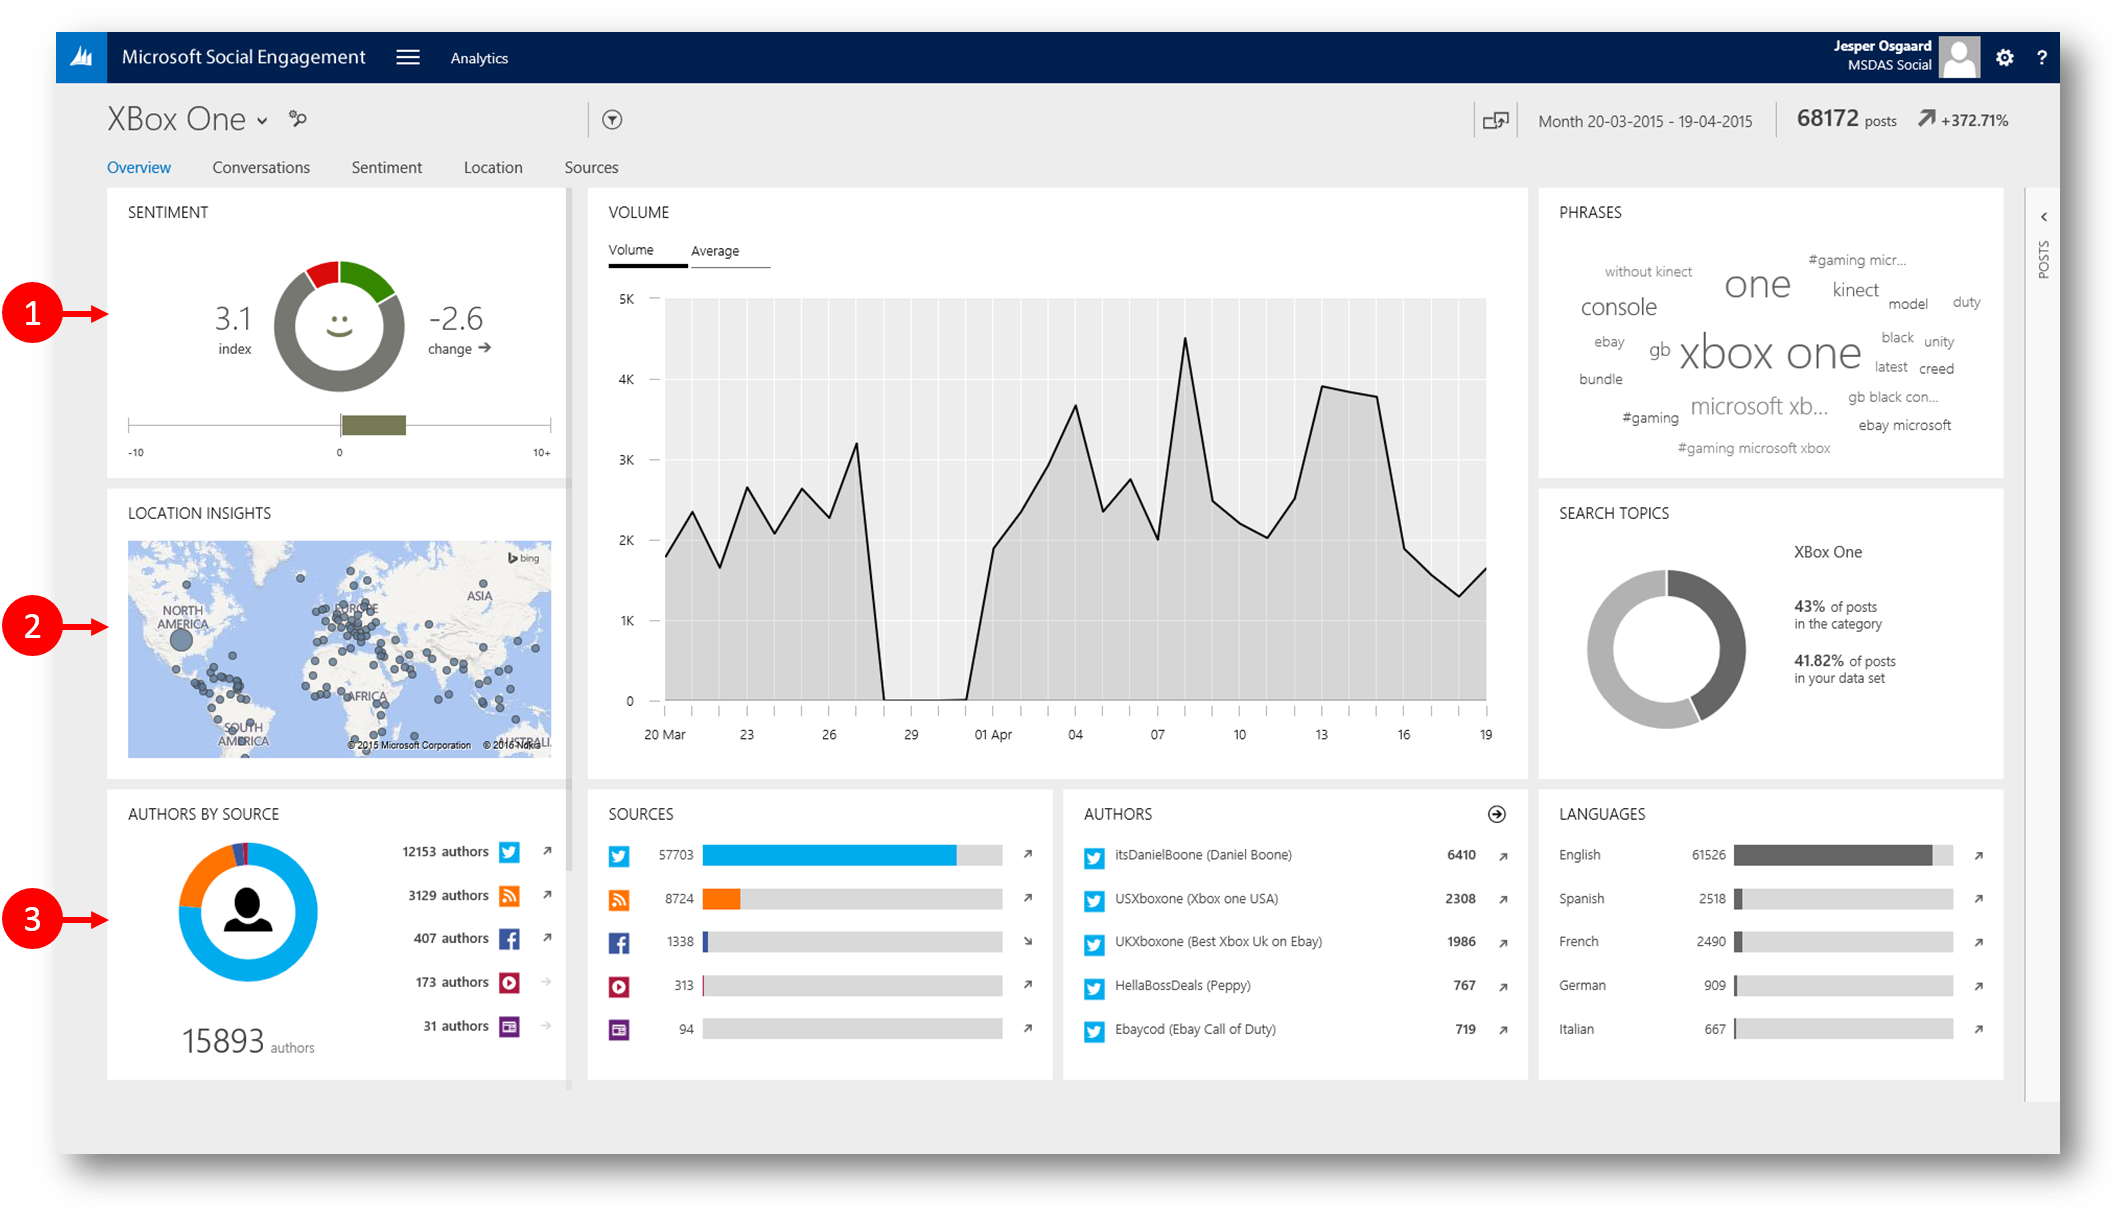
- "Sentiment"
- Displays: Sentiment index based on the type of sentiment - positive, negative or neutral.
- Metrics: Sentiment index / Volume / Trend
- "Location Insights"
- Displays: Markers for posts that contain location information
- Metrics: Volume of posts from different locations
- "Authors by Source"
- Displays: How many authors have have posts on your search topic(s) by source
- Metrics: Unique authors
The "Conversations" page
Find out what people are talking about. Using the "Conversations" page, you can understand data like the most used phrases, their volume, sources these conversations are coming from, and sentiment involved.
Static widgets on the "Conversations" page
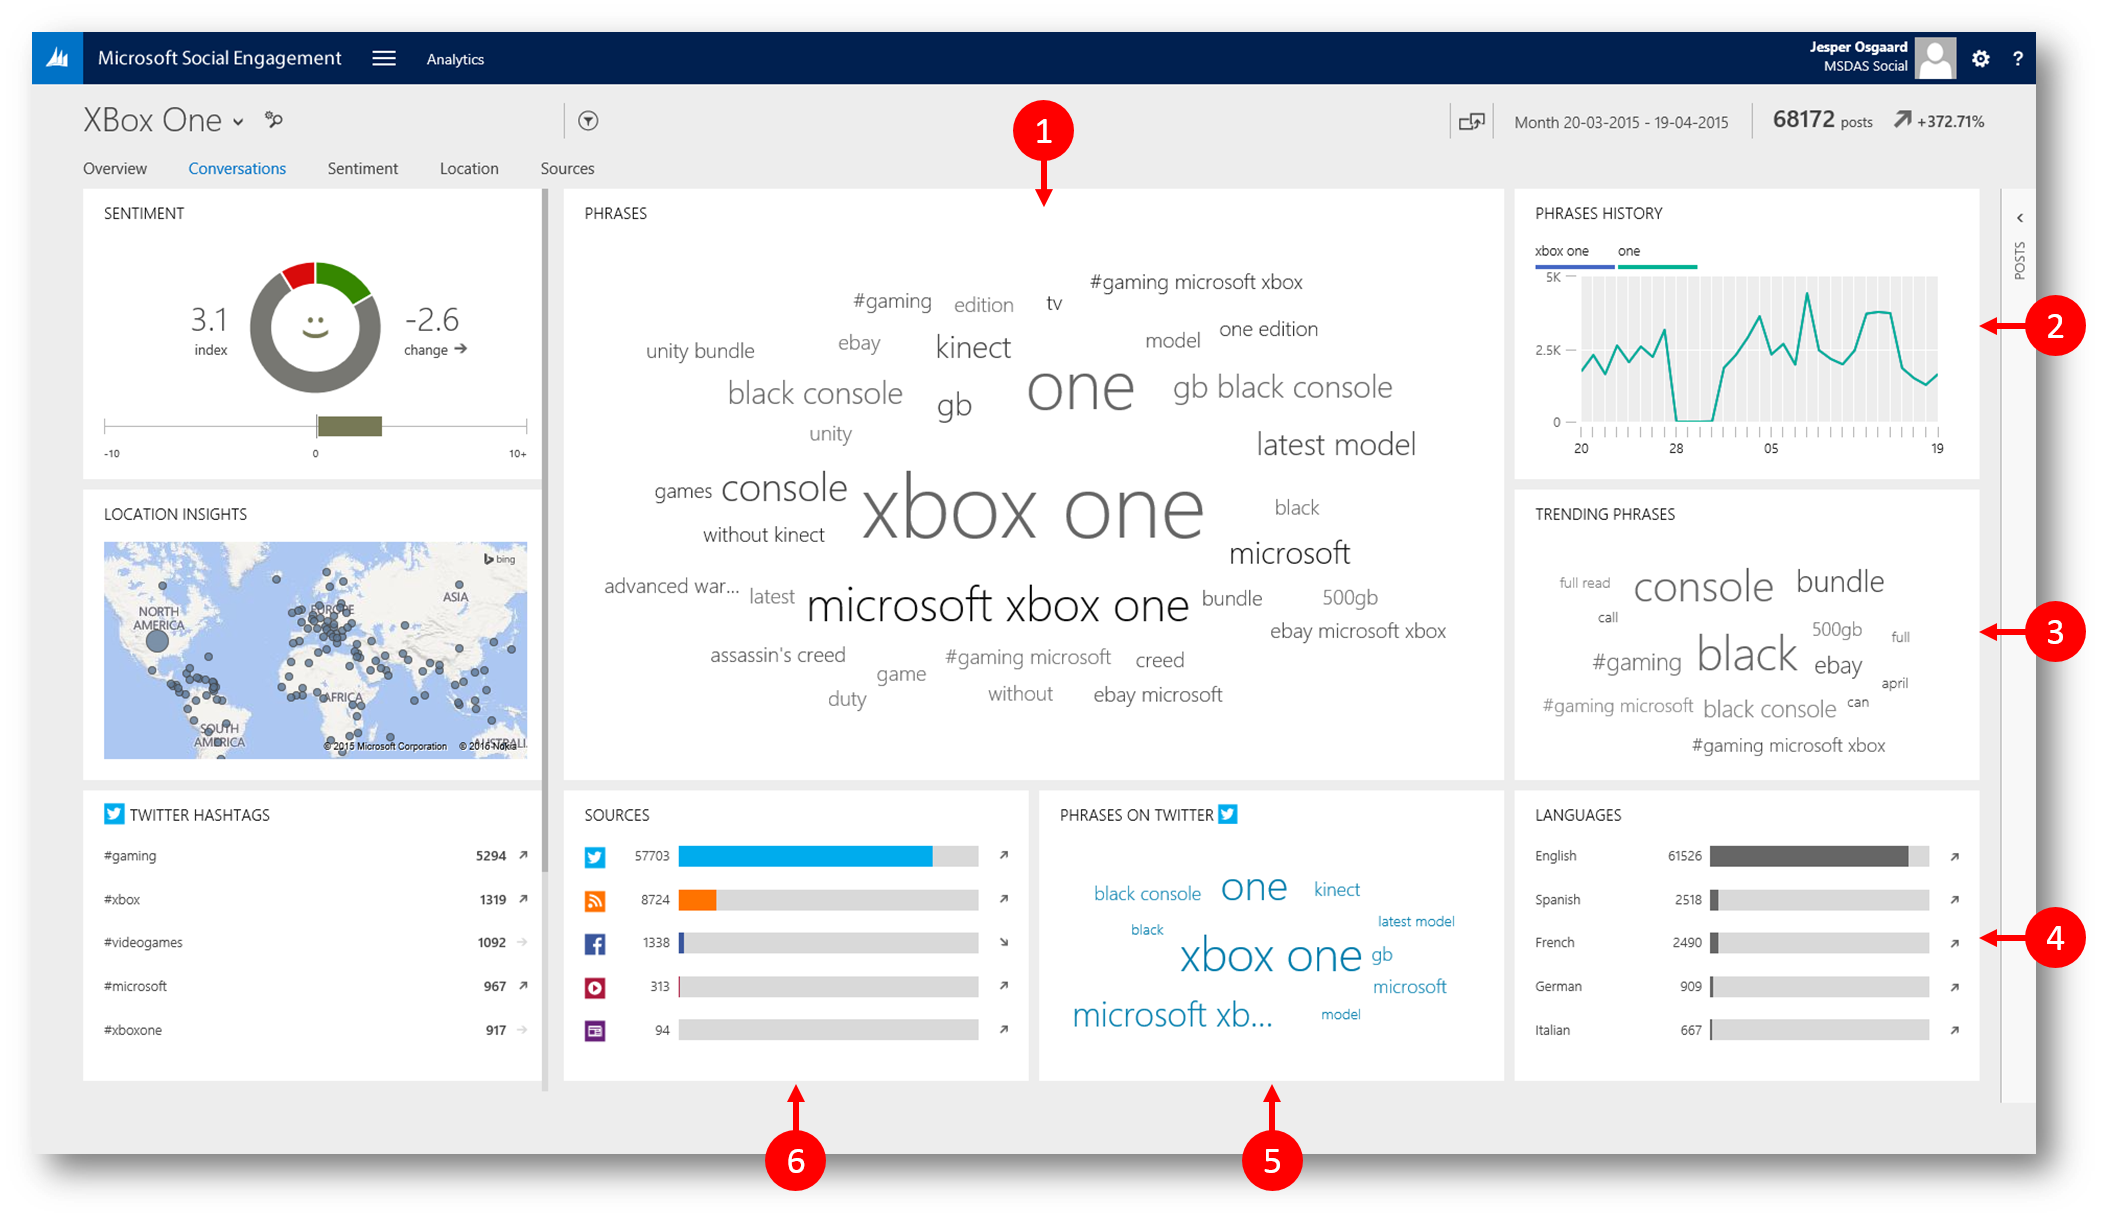
- "Phrases"
- Displays: The top phrases by volume/trend and sentiment (the phrases showing up the most in your data set)
- Metrics: Volume of posts containing a phrase
- "Phrases History"
- Displays: Top phrases by volume over time
- Metrics: Top phrases / Phrases history by volume
- "Trending Phrases"
- Displays: Significant phrases in the current data set - as compared to the significant phrases in the previous five time frames
- Metrics: Volume of posts containing a phrase / Trend
- "Languages"
- Displays: Top five languages based on volume of posts that used these languages.
Note: If the set languages are fewer than five, the available number of languages will be displayed in the order of their volume of posts - Metrics: Name of the language / Post volume / Percentage of volume as compared with the total languages spoken / Trend
- Displays: Top five languages based on volume of posts that used these languages.
- "Phrases on <Top Source>"
- Displays: Significant phrases on top source (when compared to all sources), based on the volume of the phrases on the source. In case only one source is filtered, the volume of phrases will be displayed based on the volume in the current time frame.
Note: The widget title takes the name of the top source into account. Eg: If Twitter is the top source for the current data set, the widget title will be "Phrases on Twitter". - Metrics: Post volume in the current time frame
- Displays: Significant phrases on top source (when compared to all sources), based on the volume of the phrases on the source. In case only one source is filtered, the volume of phrases will be displayed based on the volume in the current time frame.
- "Sources"
- Displays: Top five sources based on the volume of posts.
- Metrics: Volume / Percentage of volume as compared with the total volume of posts in the data set / Trend
Note
-
- Phrases are the actual set of words used in the social posts
- Two methods are used for extracting top phrases from a given set of social posts;
- Frequency-based, which is picking phrases that occur most frequently
- Significance-based, which is identifying phrases that occur more uniquely in a subset of posts as compared to the full or base set
Dynamic widgets on the "Conversations" page
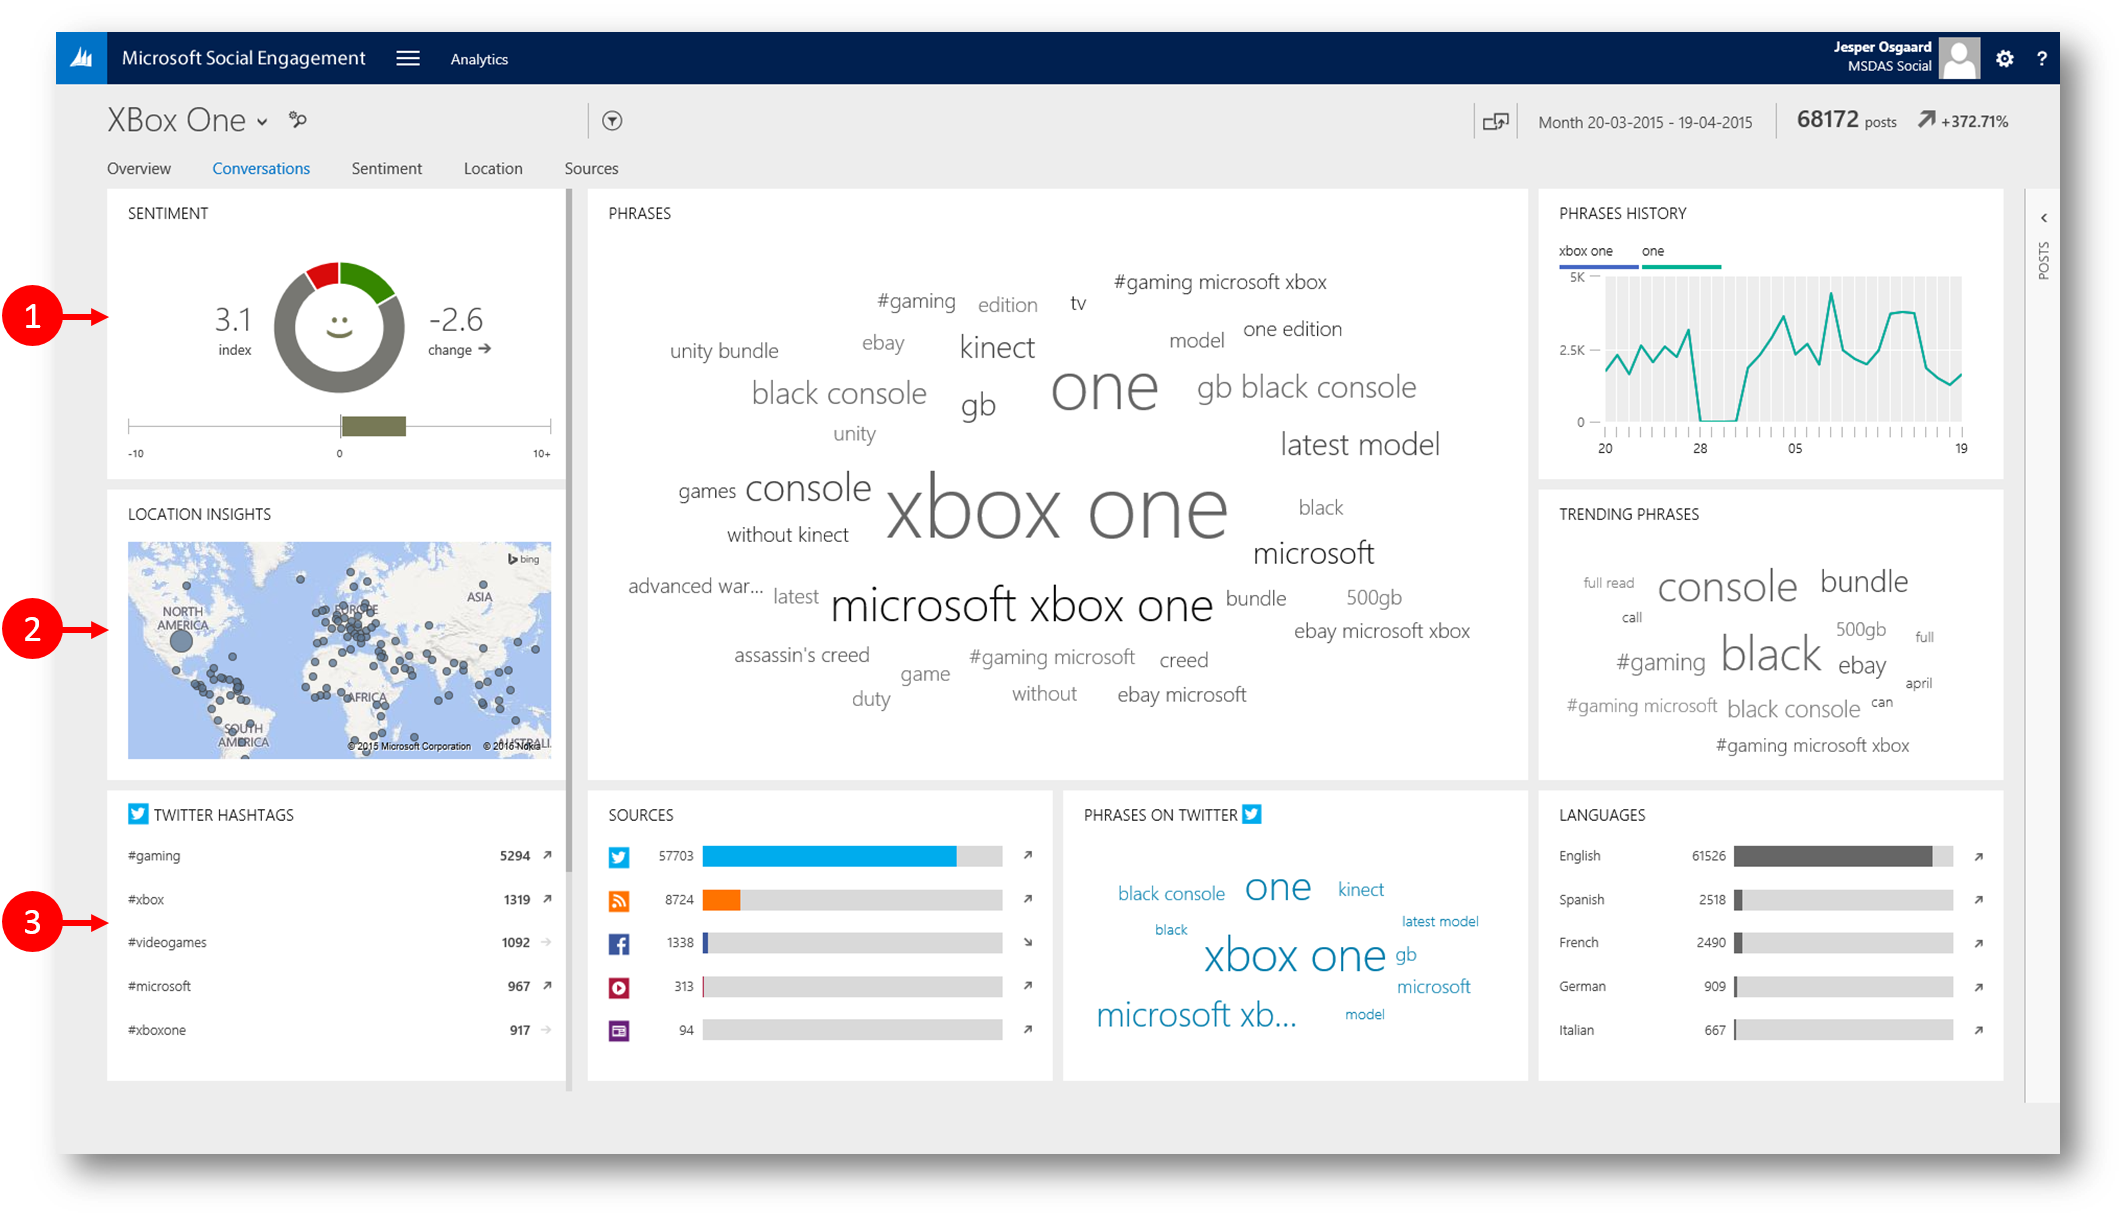
- "Sentiment"
- Displays: Sentiment index based on the type of sentiment - positive, negative or neutral.
- Metrics: Sentiment index / Volume / Trend
- "Location Insights"
- Displays: Markers for posts that contain location information
- Metrics: Volume of posts from different locations
- Twitter Hashtags
- Displays: List of the Twitter hashtags that were found most often in the posts of your current data set
- Metrics: Hashtag / Volume of posts containing the hashtag / Trend value for the hashtag
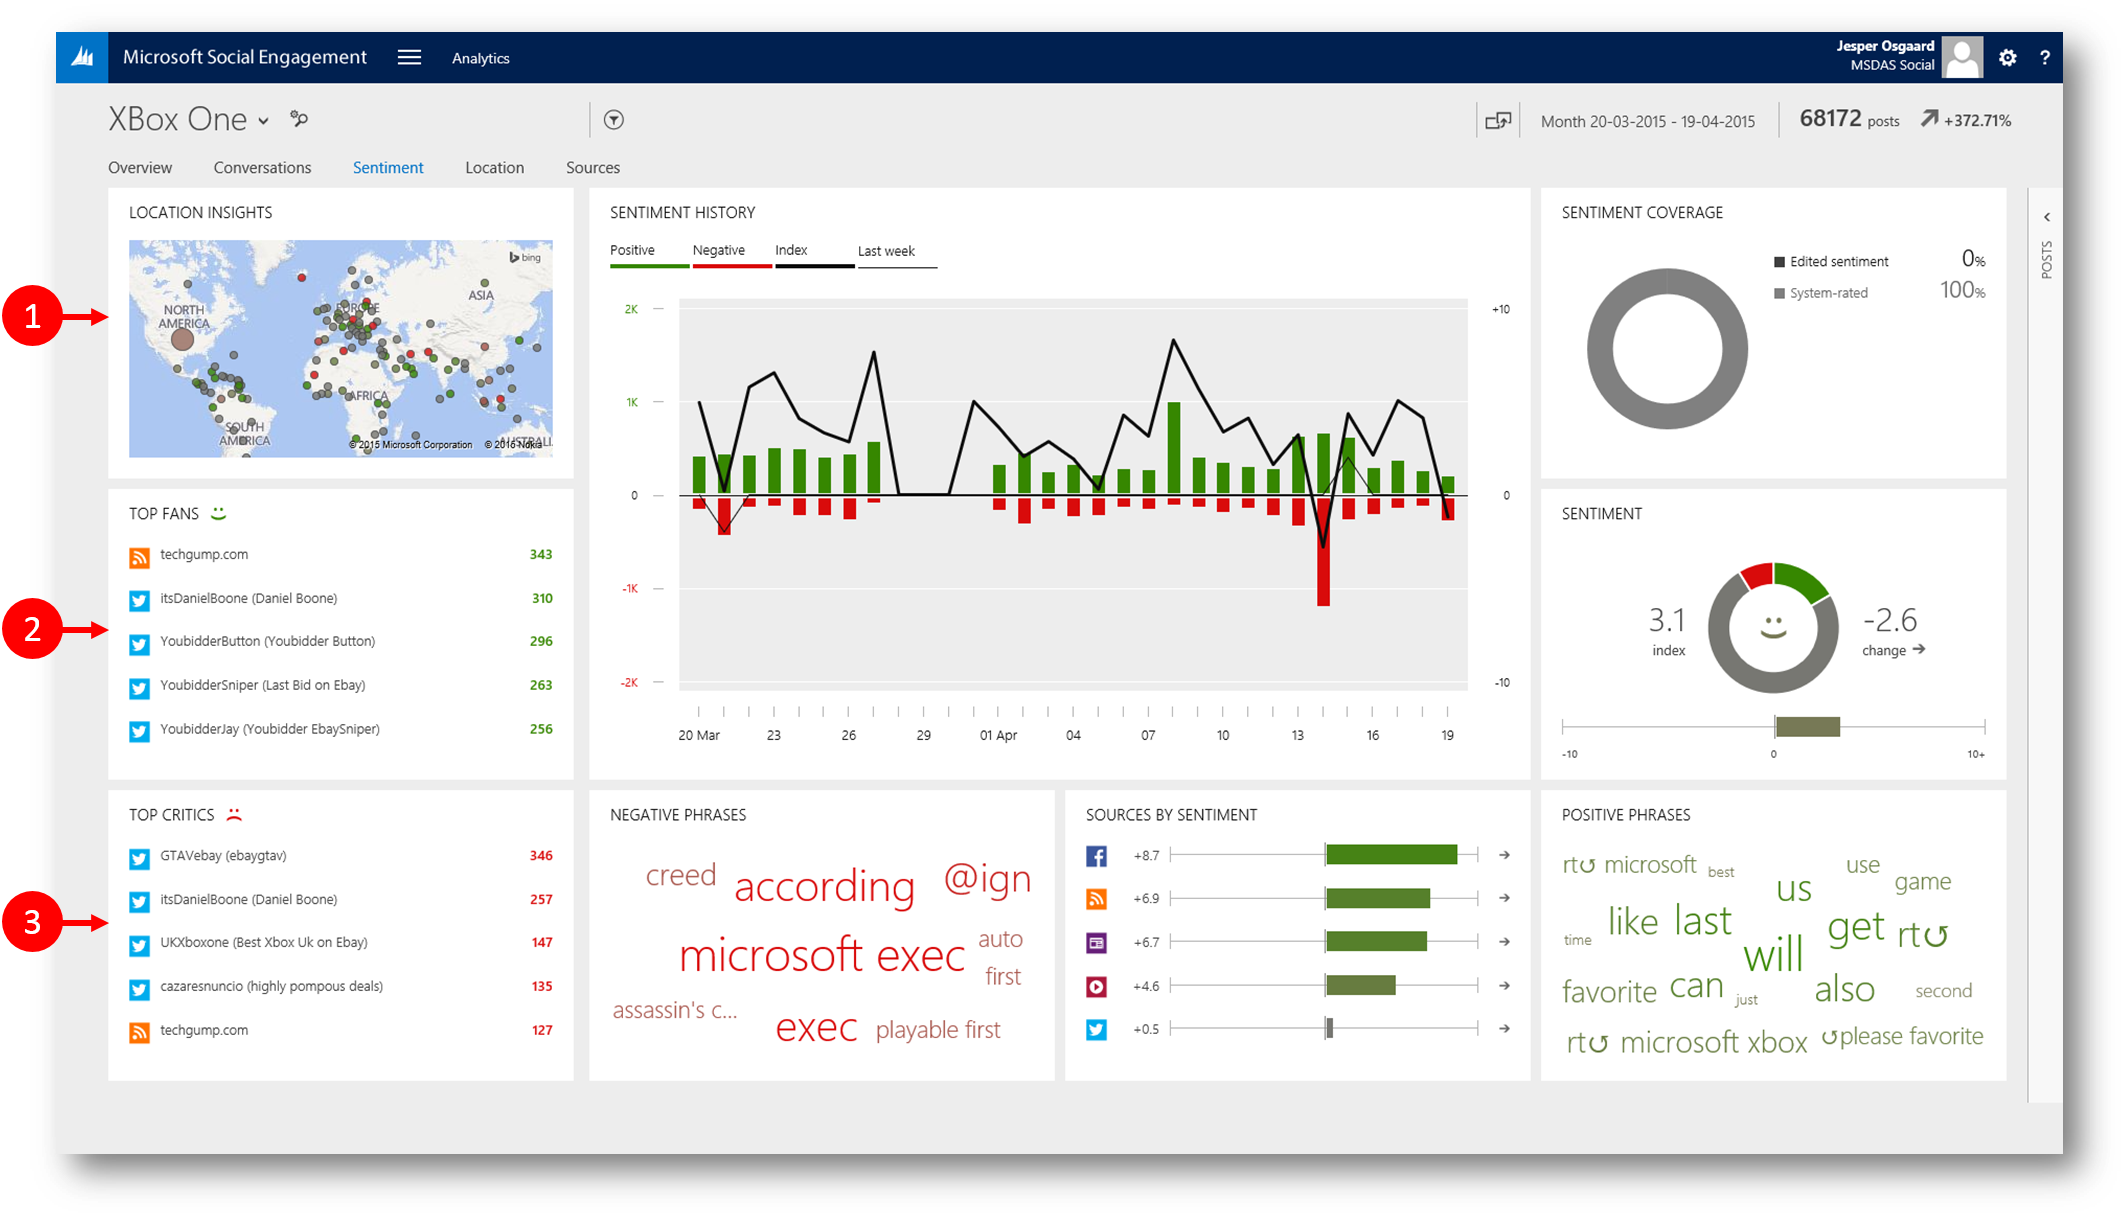
The "Sentiment" Page
Understand the public perception using sentiment analysis. View and understand the sentiments in the social chat related to your search topics. Using the "Sentiment page", MSE calculates the sentiment value of social posts with natural-language processing techniques. From the details displayed on this page, you can understand the positive, negative, or neutral sentiments and also the volume and the sources they come from. See this blog post for more: "Understanding the Sentiment Engine in Microsoft Social Listening"
Static widgets on the "Sentiment" page
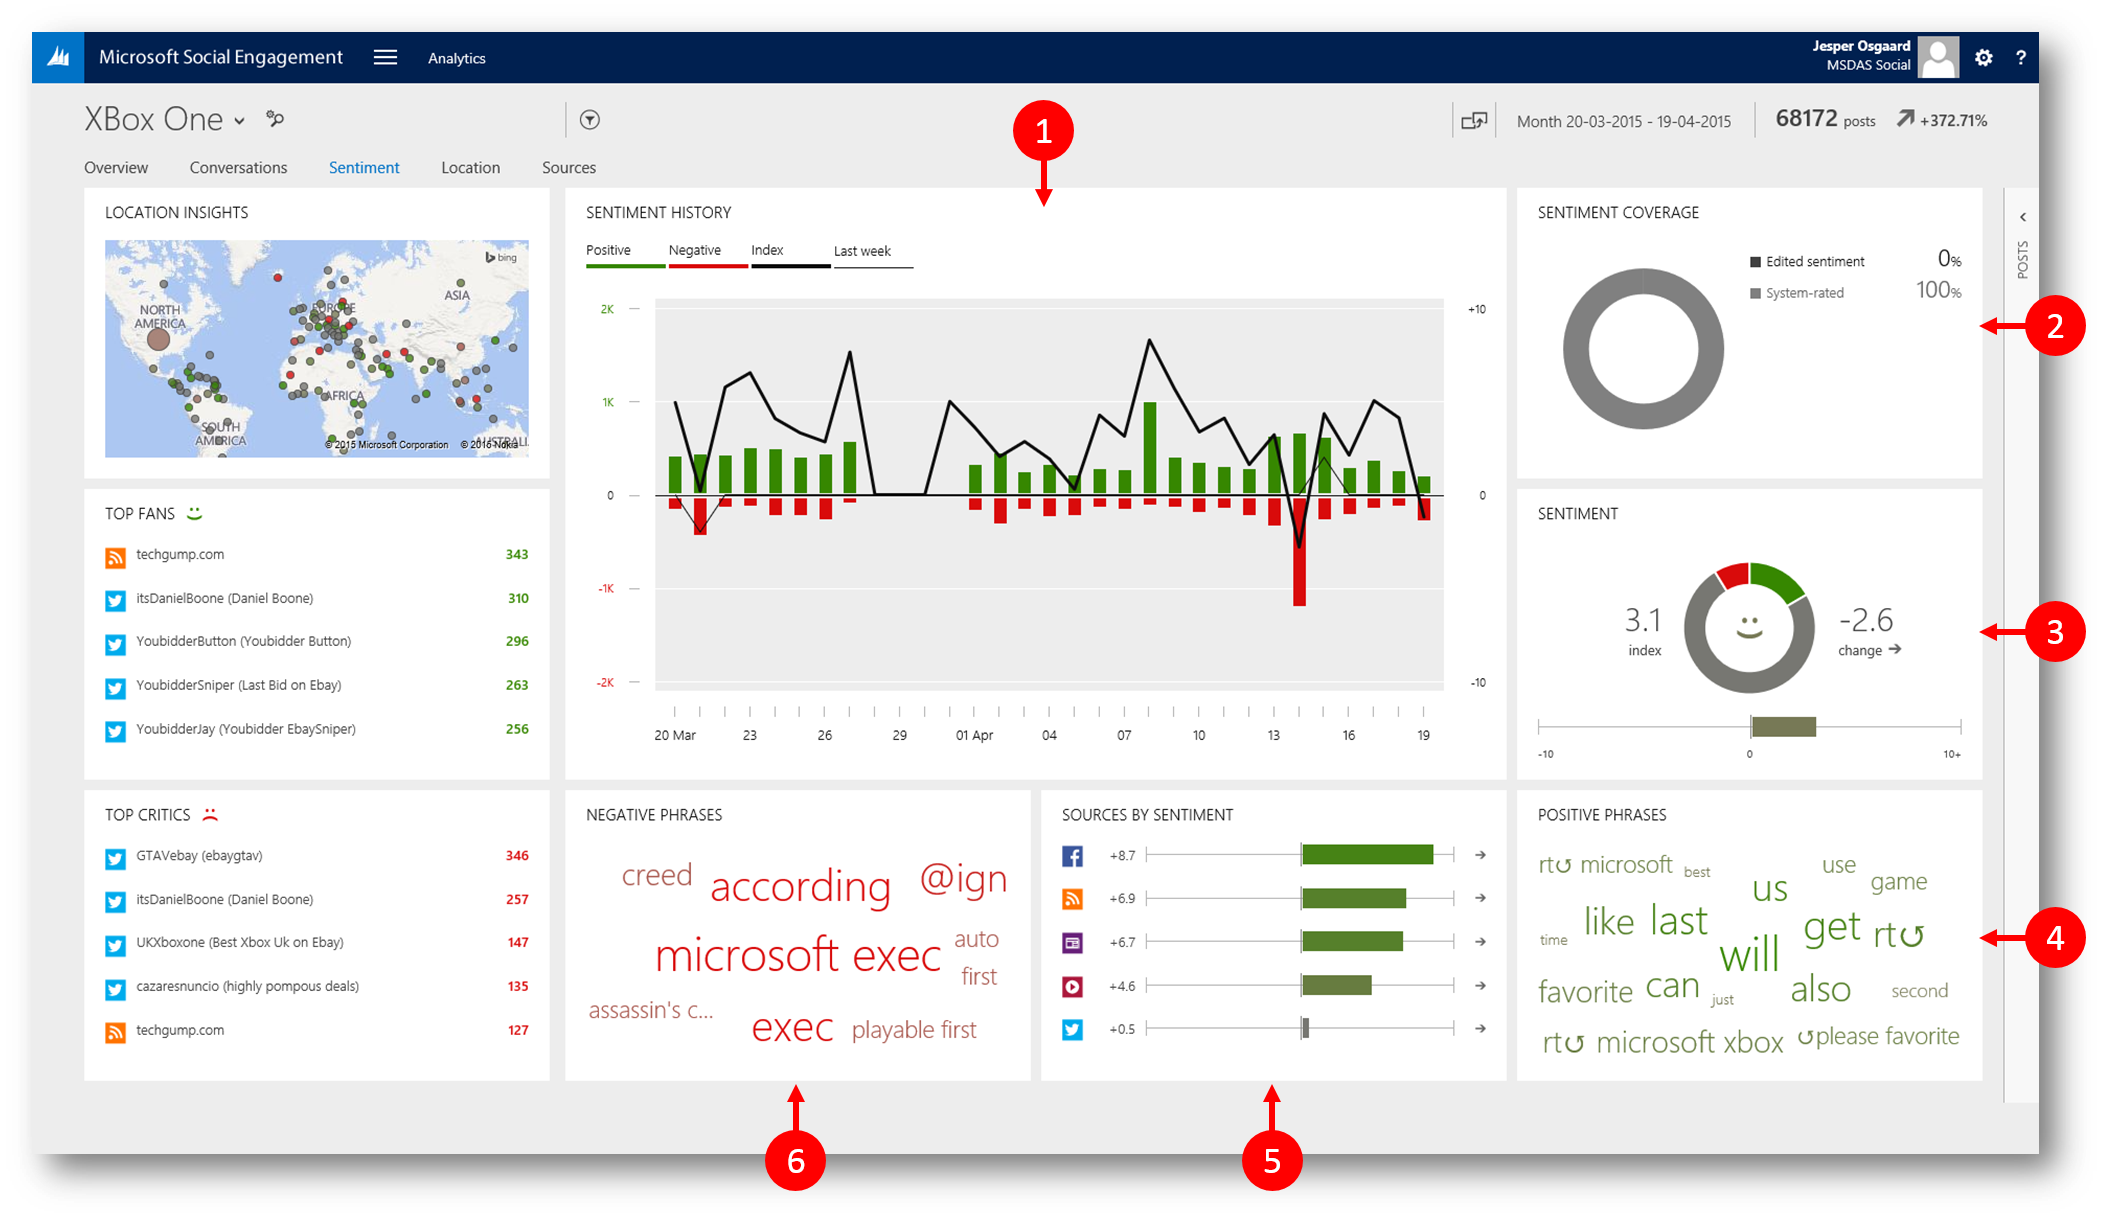
- "Sentiment History"
- Displays: Sentiment changes over different time lines, sentiment index associated with these and the sentiment index for previous period
- Metrics: Positive / Negative / Steady
- "Sentiment Coverage"
- Displays: Sentiment coverage values for the current sentiments displayed on the widgets
- Metrics: System-rated sentiment / Edited sentiment / Unknown data, if a post’s language doesn’t support sentiment calculation
- "Sentiment"
- Displays: Distribution of posts by its sentiment type
- Metrics: Index for positive, negative or neutral sentiments / Trend
- "Positive Phrases"
- Top phrases from posts with positive sentiment values
- Displays: Metrics: Phrases by volume / Sentiment index
- "Sources by Sentiment"
- Displays: Top five sources and the sentiment index for the sources
- Metrics: Sentiment index on the scale of +10 to -10 scale. / Trend.
- "Negative Phrases"
- Displays: Top phrases from posts with negative sentiment values
- Metrics: Phrases by volume / Sentiment index
Dynamic widgets on the "Sentiment" page
- “Location Insights”
- Displays: Volume and trend displayed on a map
Note: You can zoom in and perform visual filtering on this map. - Metrics: Volume of posts from different locations / Sentiment index for the posts on these locations
- Displays: Volume and trend displayed on a map
- “Top Fans”
- Displays: List of authors who published the most posts with a negative sentiment value.
- Metrics: Source / Author name / Volume of posts with positive sentiment value.
- “Top Critics”
- Displays: List of authors who published the most posts with a positive sentiment value.
- Metrics: Source / Author name / Volume of posts with negative sentiment value.
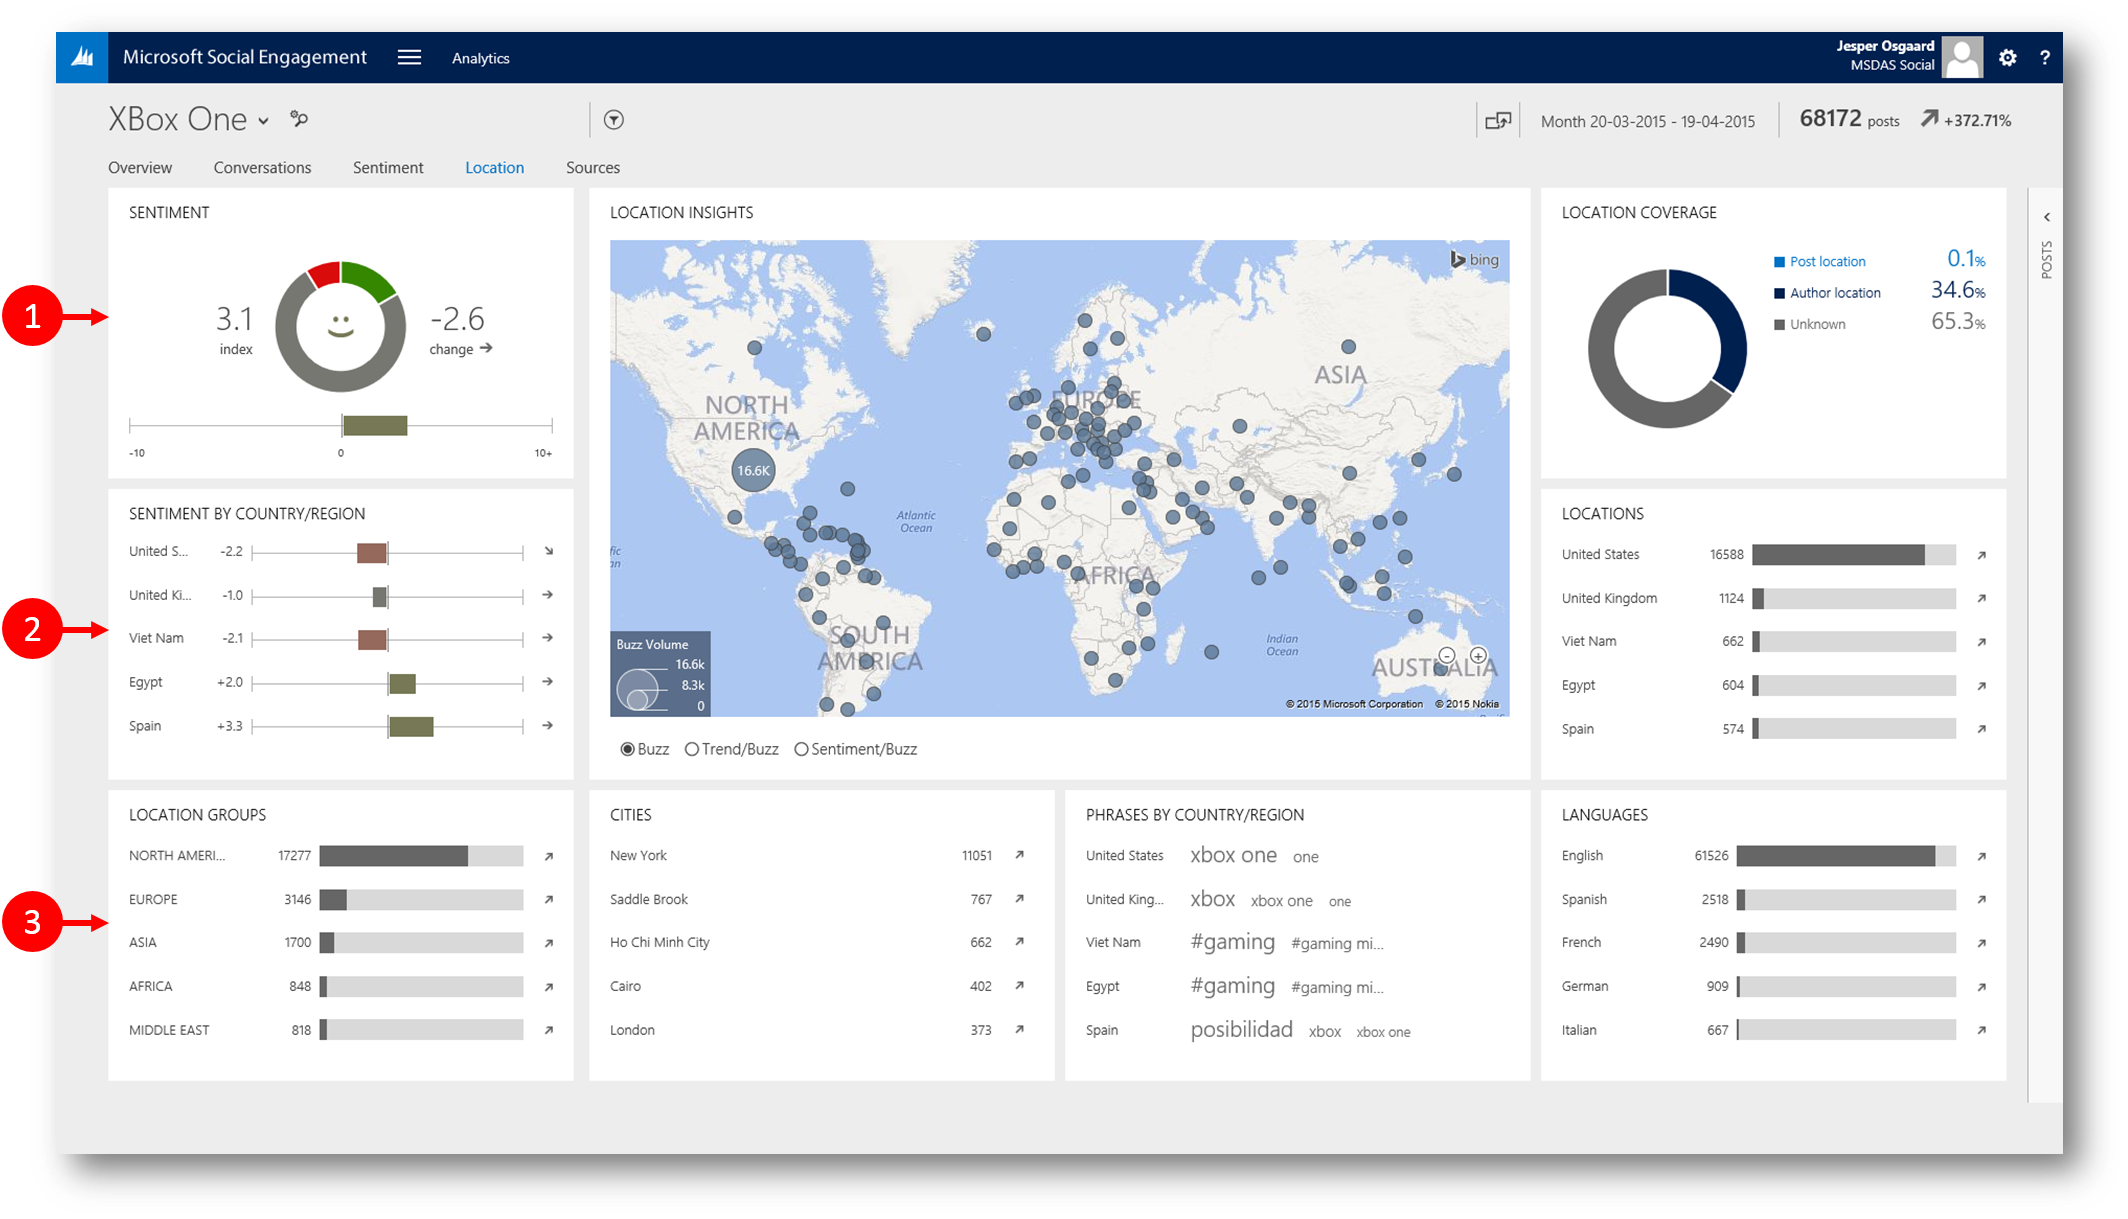
The "Location" Page
See the locations for the posts. View the analysis for the geographical location information contained in the posts or in the authors’ profiles. Using the "Location" page, you can view details such as top locations, top languages, and top location groups. See this blog post for more: "Richer Location Data Analysis in Microsoft Social Listening"
Static widgets on the "Location" page
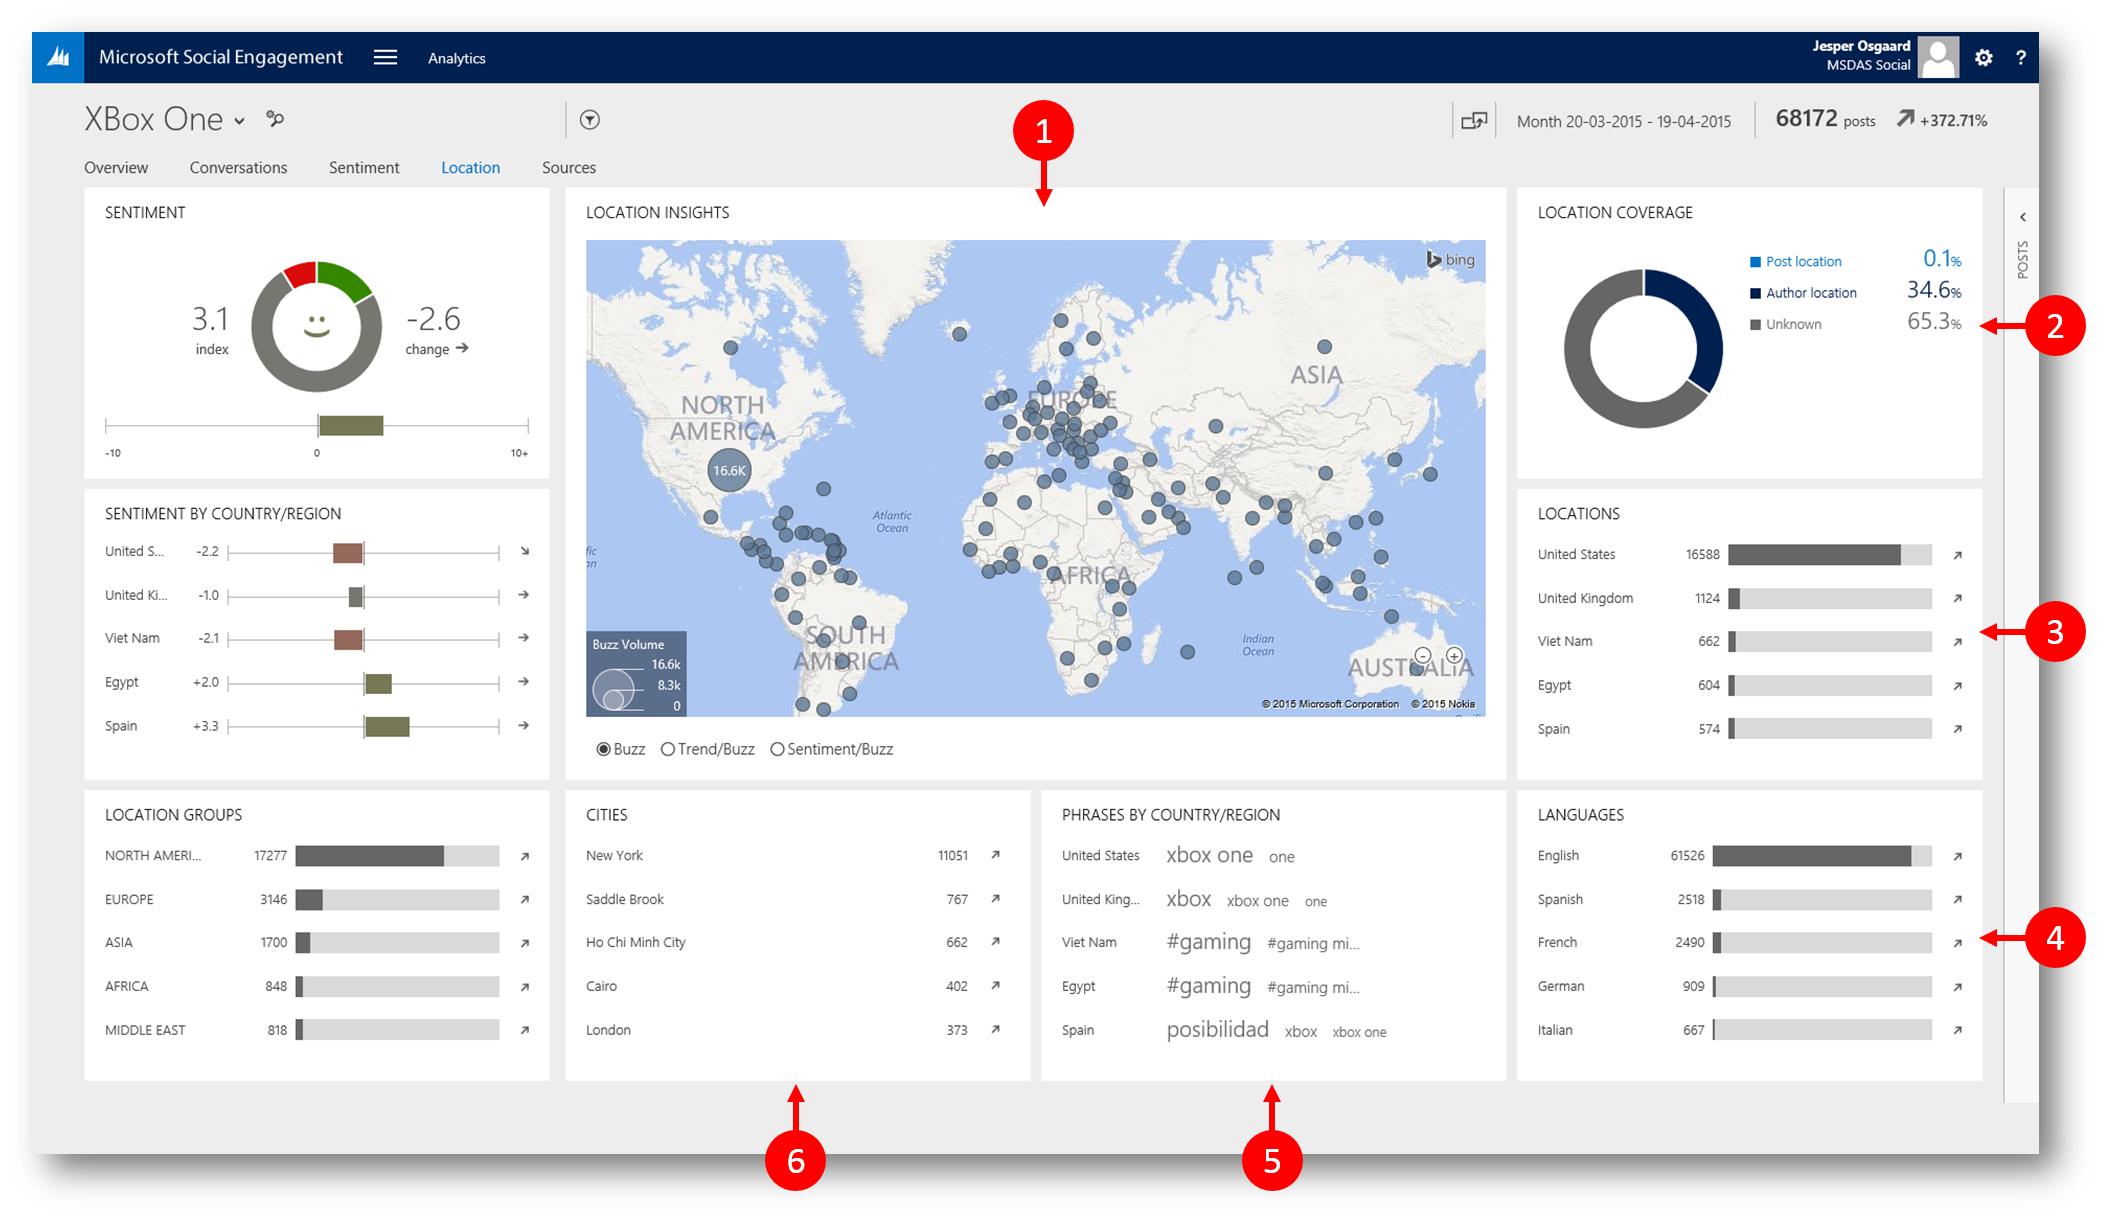
- ”Locations Insights”
- Displays: Markers for posts that contain location information.
- Metrics: Volume / Sentiment /Buzz
- ”Location Coverage”
- Displays: Percentage of posts and authors based on their location details
- Metrics: Post location / Author location / No location data available
- ”Locations”
- Displays: Top five countries/regions, based on the volume of posts
- Metrics: Name of the country/region / Volume of posts / Trend
- “Languages”
- Displays: Top five languages based on volume of posts that used these languages.
- Metrics: Name of the Language / Volume of posts / Percentage of post volume when compared with the total volume of the posts in the current data set. /Trend
- ”Phrases by Country/Region”
- Displays: Top phrases coming from the five countries/regions with the most posts
- Metrics: Name of the country/region /Most mentioned phrases in a country/region
- ”Cities”
- Displays: Top five cities based on the volume of the posts. Note: Visual filtering isn’t supported on this widget.
- Metrics: Name of the city / Volume of posts / Trend
Dynamic widgets on the "Location" page
- “Sentiment”
- Displays: Sentiment index based on the type of sentiment - positive, negative or neutral.
Note: You can manually change the sentiment values in case you think any posts are incorrectly analyzed for the sentiment index. - Metrics: Sentiment index on the scale of -10 to +10 / Volume / Trend
- Displays: Sentiment index based on the type of sentiment - positive, negative or neutral.
- “Sentiment by Country/Region”
- Displays: Sentiment index by country/region and trend of the sentiment index
- Metrics: Names of the top five countries/regions based on the post volume / Sentiment index on the scale of – 10 to +10 / Trend of the sentiment index
- “Location Groups”
- Displays: Top five location groups. Note:If fewer than five location groups are available, the available location groups are listed based on the volume of posts.
- Metrics: Location group name / Volume of posts / Trend
The "Sources" Page
Analyze the sources for the posts. Understand which top social media sources are found most often in your search topics. Using the Sources page, you can view analytics such as top sources, top languages and the sentiment values involved with the posts on these sources.
Static widgets on the "Sources" page
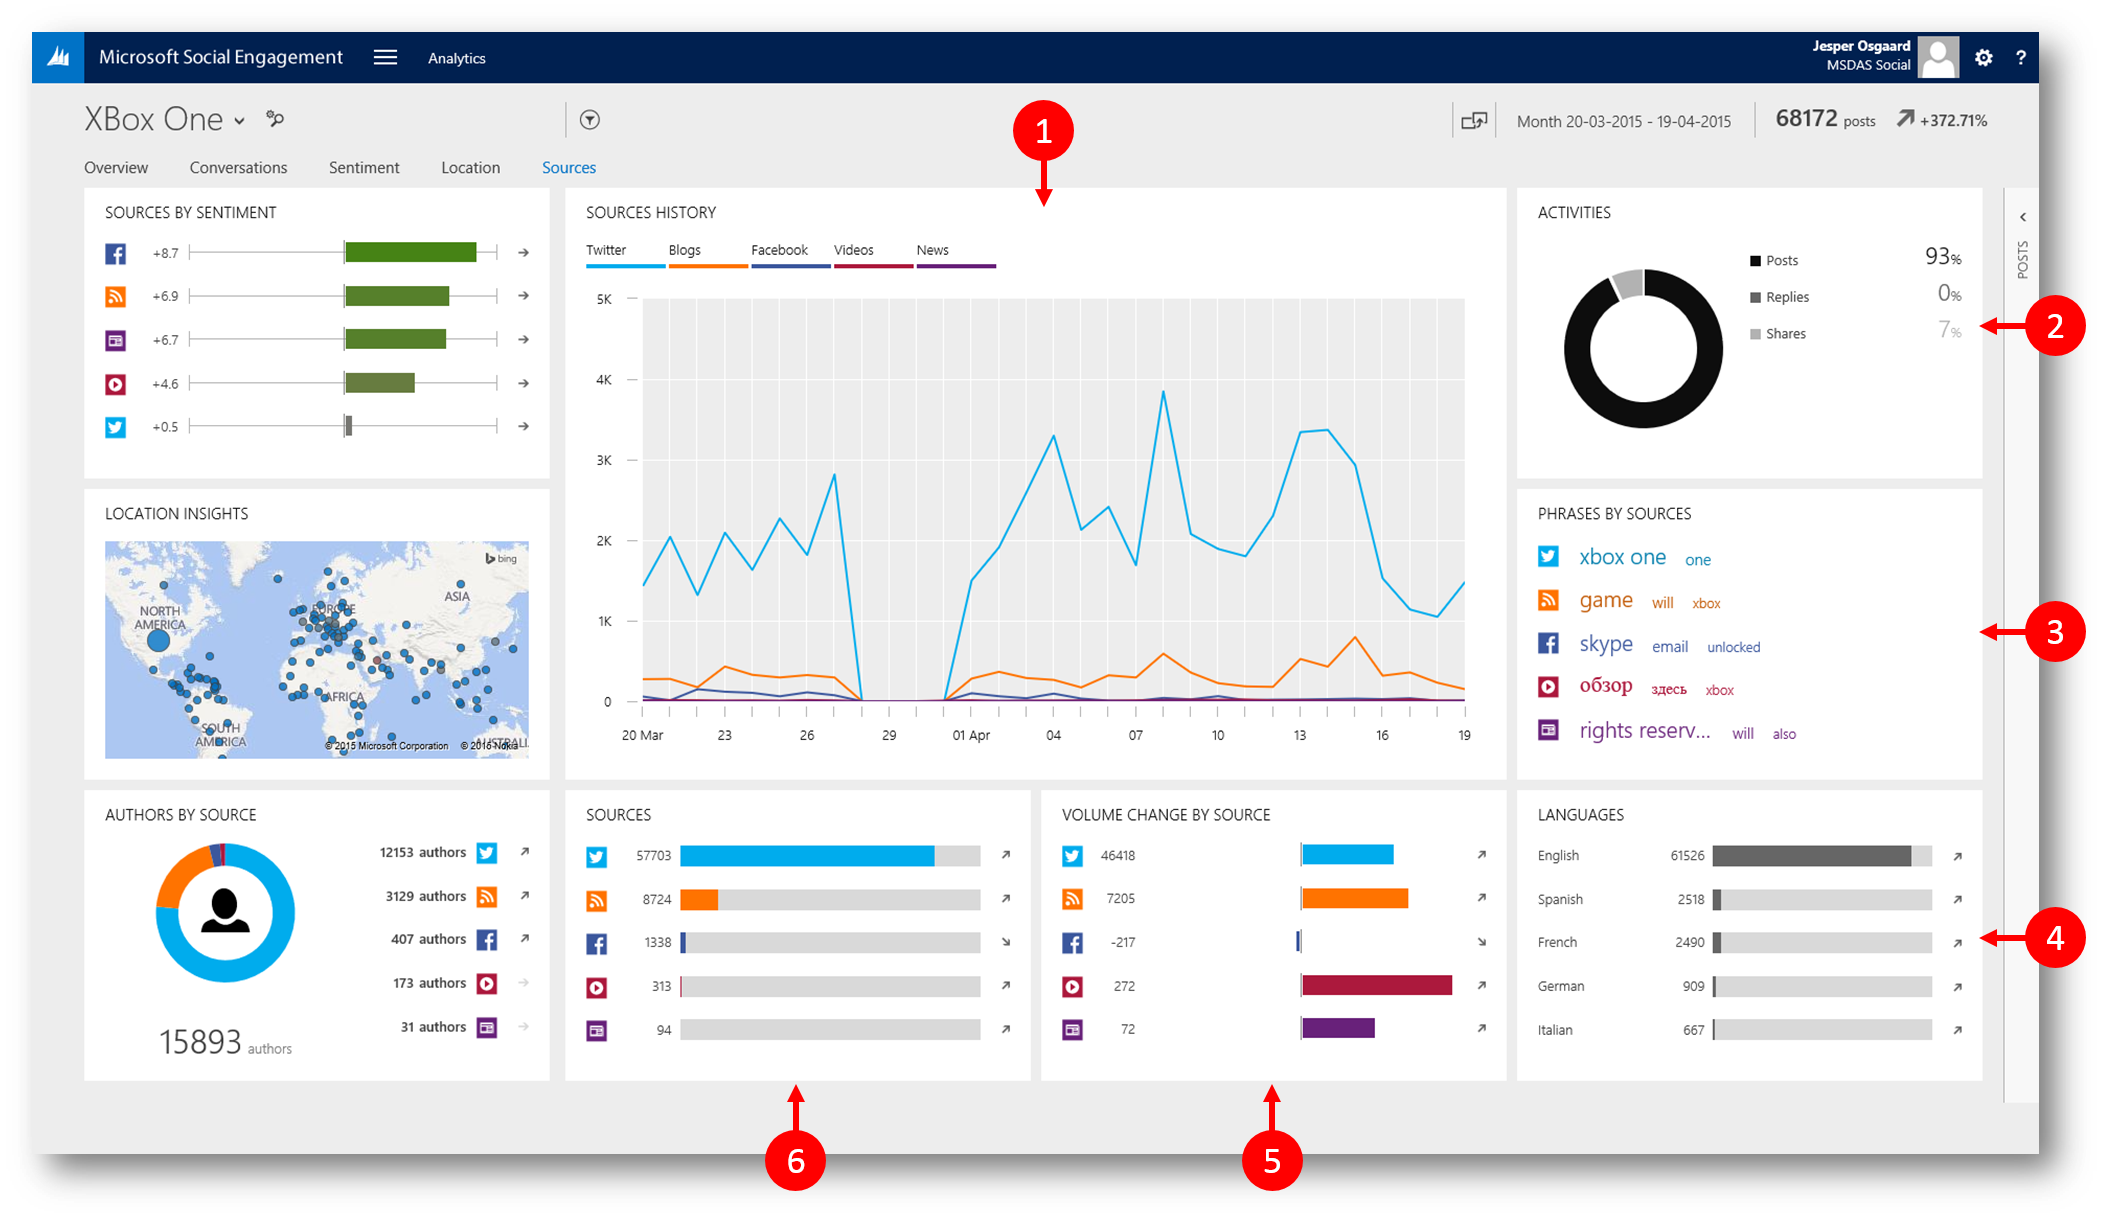
- ”Sources History”
- Displays: Volume history for posts from the different sources in the selected time frame.
- Metrics: Post volume
- ”Activities”
- Displays: Type of posts based on the volume.
- Metrics: Percentage of common posts / Percentage of comments and replies / Percentage of retweets and shares
- ”Phrases by Sources”
- Displays: Top phrases for the top five sources based on the volume.
- Metrics: Source icon / Phrases
- ”Languages”
- Displays: The list of five most spoken languages based on the volume of posts using these. Note: If the set languages are less than five, the available number of languages will be displayed in the order of their volume of posts.
- Metrics: Top five languages based on the volume of posts using these / Percentage of posts volume when compared with the total volume of the posts in the current data set / Trend
- ”Volume Change by Source”
- Displays: Change in post volume for the top five sources, whether increasing or decreasing as compared to previous periods.
- Metrics: Name of the source / Volume change / Trend
- ”Sources”
- Displays: Top sources in your data set by post volume.
- Metrics: Source icon / Post volume / Trend
Dynamic widgets on the "Sources" page
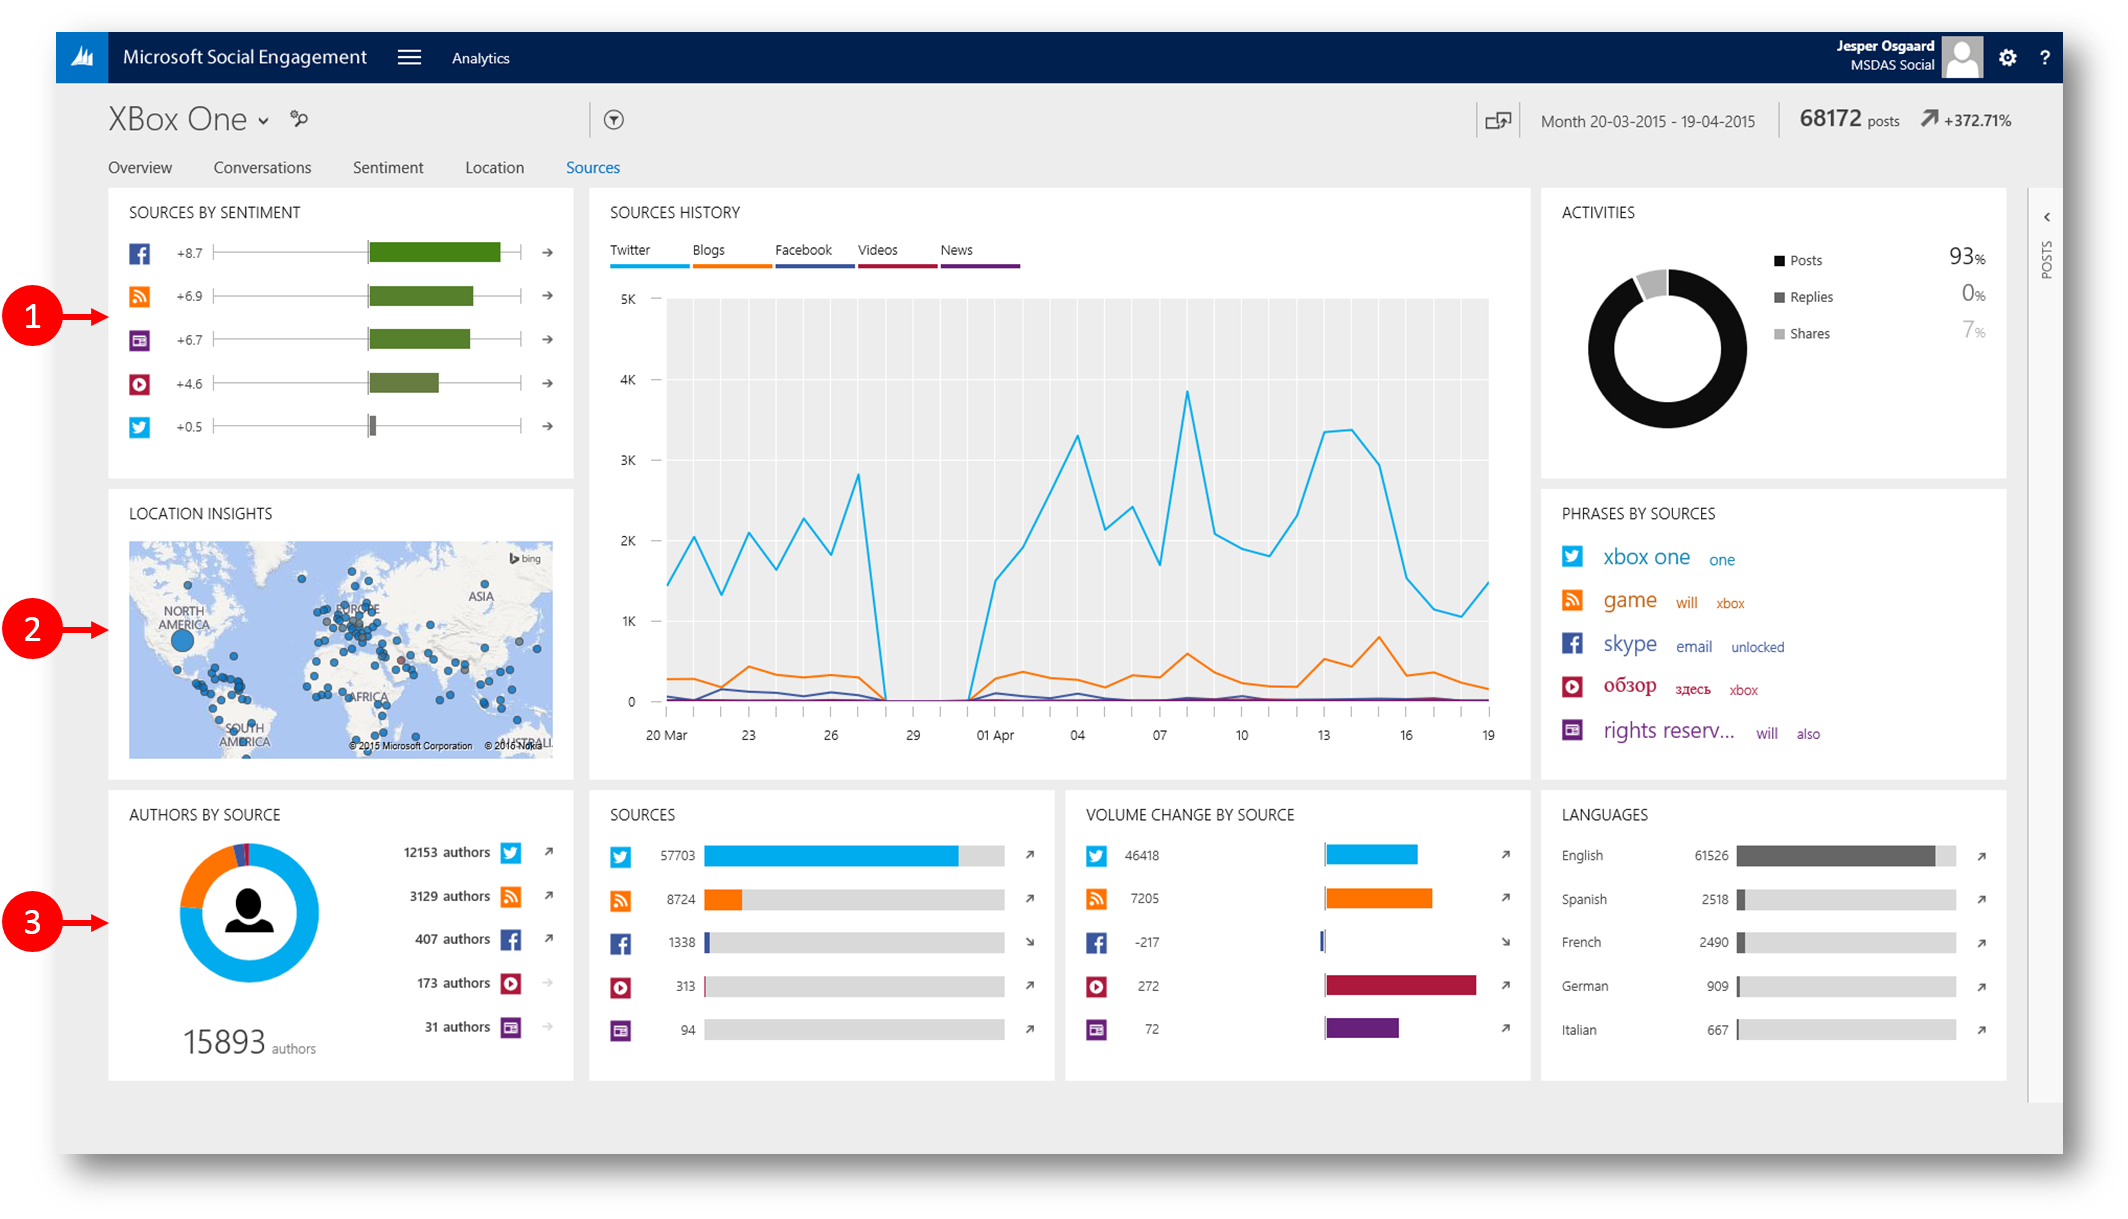
- ”Sources by Sentiment”
- Displays: Top five sources along with their sentiment index.
Note: If five sources aren’t available, the available number of sources are displayed, based on their volume. - Metrics: Names of the top five sources by volume / Trend of the sentiment index
- Displays: Top five sources along with their sentiment index.
- ”Location Insights”
- Displays: Markers for posts that contain location information.
- Metrics: Volume of posts in different locations
- ”Authors by Source”
- Displays: Top five sources based on the number of unique authors.
- Metrics: Total number of unique authors / Percentage of the number of authors per source / Top five sources / Number of unique authors per source / Trend
So using these five pages of the "Analytics" dashboard I can understand what my customers or prospects are saying about my product Xbox One. I can identify any issues or appreciations mentioned about my products or services on social media sources.
See also
- Blog series on Microsoft Social Listening - link