A nice report on Distributed Application component state
When you need a report and you suddenly see that it’s impossible (or possible, but there are easier ways to accomplish this) via standard reports in Operations Manager, you first starting to fight with a tool that comes in handy on ACS – Report Builder. Well, maybe that’s just me, but playing with RB on standard reporting OM playground is like trying to fish a shark with a jelly bait.
When I was young and full of grace… I tried not to anything which had a bit of Visual part in its name. For me Visual Studio = programming and boring typing of code blocks. That may be true for 90% of work, but fortunately writing (that’s a tough word, composing is more accurate) reports in Visual Studio is a really piece of cake. That’s what I found out lately when pushed to the wall was given a task – report which shows live state of objects which are bits of custom Distributed Application.
Before I go into this task step-by-step, I will confess myself. I tried to do that by copying Kevin Holman’s custom stuff, some example reports, I’ve read few posts on this – nothing lit a candle in my dark space of brain. I’m a type of person who loves two things – getting it done by myself and… wizards. All types of wizards are having +1 for my happiness.
Before you start… make sure you follow few steps, which are needed to be done on Business Intelligence 2008 and 2008 R2 Studio from SQL Server installation (yes, you need to install that to start work – just launch setup and from Shared Features choose that BI one). All necessary steps are available on Oleg Kapustin’s blog.
Let’s start… and to do that we need to prepare a plan. This plan would contain vision, materials and data to work with. Let’s begin with vision.
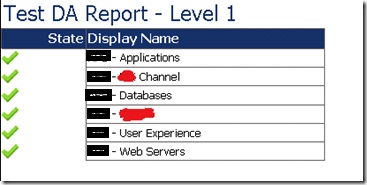
Vision : A tabular report on main DA part and Level 1 containers which we create in Distributed Application designer. Level 2 report can also be available as a detailed version of our report (real world scenario: business wants less data, administrators – more of it). The report should show graphical indicator of healthy, warning or critical state, not only numeric or word entries. This would be fun!
Materials: This should be prepared basing of our vision. So graphical indicators… will be icons from OM or any other icons you can find for ok, warning or critical values. Best ones would be max 20x20 px. Also we will make use of SQL Server Management Studio to connect to the database, so you can start opening this one right now, as we will need…
Data to work with: I’ve had a discussion whether to work on OperationsManagerDW or OperationsManager database for this report. It’s easier to find all the data in OM live database but there’s one point you should be aware of. Live data is live data – it changes a lot. When you create a small report from one table and this is a state change for example which doesn’t flicker a lot, it’s rather safe. Be sure to use WITH (NOLOCK) clause on SQL queries as this won’t lock tables for query and will allow other queries to run against it without waiting for your process to finish.
How to query an OperationsManager database for health state of components of distributed application? Good question. You can do it in two ways – like a robot or like a brain. Robot method would be to query BaseManagedEntity table for known part names of application. This however is causing a need to rewrite dataset if your DA will change in future. So second method is much nicer. We can use in-built procedure to query for all predecessors of any object. In our case those would be kids of our DA.
------
select s.HealthState, b.DisplayName, UPPER(SUBSTRING(b.FullName, CHARINDEX(':', b.FullName)+1, 50)) as CompService
from dbo.fn_ContainedBaseEntitiesFromList('84BB11C7-29D1-DD9C-C228-3FEC82533499', 2) a
left join dbo.BaseManagedEntity b on
a.BaseManagedEntityId = b.BaseManagedEntityId
inner join dbo.State s on
a.BaseManagedEntityId = s.BaseManagedEntityId
where Depth <= 2 and s.MonitorId = 'E3AB86A1-34FA-35B5-B864-DA4DB993C0F5'
order by b.DisplayName, CompService asc
-------
Let’s explain a bit. dbo.fn_ContainedBaseEntitiesFromList is an in-built procedure which retrieves contained items from specific object (represented as a GUID here) and we can but how many levels down it should return. Funny thing is that every number below 1 returns all contained objects, so when I put two, it gave up to level 6. That is why I restricted values only to level 2 (for admin report) and we can do it also only for level 1. When you want to return only level 1 items (LOB App –> Databases, LOB App –> Web Servers, LOB App –> Services), you don’t need that CompService column as this part trims down those long values which are seen as path in return from query (it cuts it just to have computer FQDN name of instance). So for Level 1 items it would be like this:
------
select s.HealthState, b.DisplayName
from dbo.fn_ContainedBaseEntitiesFromList('84BB11C7-29D1-DD9C-C228-3FEC82533499', 1) a
left join dbo.BaseManagedEntity b on
a.BaseManagedEntityId = b.BaseManagedEntityId
inner join dbo.State s on
a.BaseManagedEntityId = s.BaseManagedEntityId
where Depth = 1 and s.MonitorId = 'E3AB86A1-34FA-35B5-B864-DA4DB993C0F5'
order by b.DisplayName asc
-------
Order by clause is just for fun and to be sure everything is properly arranged. '84BB11C7-29D1-DD9C-C228-3FEC82533499' GUID is my DA main application (like LOB App) and 'E3AB86A1-34FA-35B5-B864-DA4DB993C0F5' GUID is a monitor ID for Entity (so top one). That way I represented in numeric value (s.HealthState) a state of all main parts of DA. The first GUID you should search in BaseManagedEntiity table by your app name.
Having those queries we can then do our first report. Let’s start then. Open Business Intelligence (properly configured).

The first screen allow you to choose from variety of Visual Studio templates. Choose Report Server Project.

In new project window on the right side you will see small box called Solution Explorer. From there right click Reports and choose Add New Report.
![clip_image001[4]](https://msdntnarchive.blob.core.windows.net/media/TNBlogsFS/prod.evol.blogs.technet.com/CommunityServer.Blogs.Components.WeblogFiles/00/00/00/96/24/metablogapi/5228.clip_image0014_766F1998.png "clip_image001[4]")
My beloved wizard opens :)
![clip_image001[6]](https://msdntnarchive.blob.core.windows.net/media/TNBlogsFS/prod.evol.blogs.technet.com/CommunityServer.Blogs.Components.WeblogFiles/00/00/00/96/24/metablogapi/5025.clip_image0016_157BEFD8.png "clip_image001[6]")
On the next screen we will create a data source to our main OperationsManager database (not Warehouse!). In the Select Data Source window click New Data Source and Edit. This will pop-up Properties window which you can intuitively fill in.
![clip_image001[8]](https://msdntnarchive.blob.core.windows.net/media/TNBlogsFS/prod.evol.blogs.technet.com/CommunityServer.Blogs.Components.WeblogFiles/00/00/00/96/24/metablogapi/0726.clip_image0018_3A5964B7.png "clip_image001[8]")
You can Test Connection is everything is ok. After accept you can mark this data source as a shared one for future references which is a good idea.
![clip_image001[10]](https://msdntnarchive.blob.core.windows.net/media/TNBlogsFS/prod.evol.blogs.technet.com/CommunityServer.Blogs.Components.WeblogFiles/00/00/00/96/24/metablogapi/6165.clip_image00110_070D0581.png "clip_image001[10]")
On the next screen paste your query from Management Studio. For our demonstration I will use level 1 query.
Next select Tabular report type.
On Design Table do not drag any fields, just hit Next.
Then choose your layout and complete the wizard. You should see something similar to mine.

Now for some tweaking. As you see my report name will only be about Level 1 items. Let’s hide the Health State column first and then add second one as just State for future images. Click the Health State column and then right click it and choose Column Visibility.
![clip_image001[12]](https://msdntnarchive.blob.core.windows.net/media/TNBlogsFS/prod.evol.blogs.technet.com/CommunityServer.Blogs.Components.WeblogFiles/00/00/00/96/24/metablogapi/2437.clip_image00112_21893033.png "clip_image001[12]")
Change the value to Hide.
![clip_image001[14]](https://msdntnarchive.blob.core.windows.net/media/TNBlogsFS/prod.evol.blogs.technet.com/CommunityServer.Blogs.Components.WeblogFiles/00/00/00/96/24/metablogapi/0383.clip_image00114_30603980.png "clip_image001[14]")
Now add new column. Again right click Health State column and choose Add New Column to the left. Click a header, then double click and enter State name.
![clip_image001[16]](https://msdntnarchive.blob.core.windows.net/media/TNBlogsFS/prod.evol.blogs.technet.com/CommunityServer.Blogs.Components.WeblogFiles/00/00/00/96/24/metablogapi/5732.clip_image00116_1402D193.png "clip_image001[16]")
Now for the best part. We need to put images somehow here and change them basing on values of HealthState field (1 is healthy, 2 is warning, 3 is critical, 0 will be uninitialized, so if you want to show this one too, prepare 4th icon for this one).
On the left side click Images and from right click menu choose Add Image.
![clip_image001[18]](https://msdntnarchive.blob.core.windows.net/media/TNBlogsFS/prod.evol.blogs.technet.com/CommunityServer.Blogs.Components.WeblogFiles/00/00/00/96/24/metablogapi/5557.clip_image00118_28587151.png "clip_image001[18]")
![clip_image001[20]](https://msdntnarchive.blob.core.windows.net/media/TNBlogsFS/prod.evol.blogs.technet.com/CommunityServer.Blogs.Components.WeblogFiles/00/00/00/96/24/metablogapi/4075.clip_image00120_33355299.png "clip_image001[20]")
After you finish you should see your items.
![clip_image001[22]](https://msdntnarchive.blob.core.windows.net/media/TNBlogsFS/prod.evol.blogs.technet.com/CommunityServer.Blogs.Components.WeblogFiles/00/00/00/96/24/metablogapi/6644.clip_image00122_76F96123.png "clip_image001[22]")
Now drag one of the images from this list into empty field below State. Right click this field then and open Properties.
![clip_image001[24]](https://msdntnarchive.blob.core.windows.net/media/TNBlogsFS/prod.evol.blogs.technet.com/CommunityServer.Blogs.Components.WeblogFiles/00/00/00/96/24/metablogapi/3808.clip_image00124_635BDBB5.png "clip_image001[24]")
You can see that this field will use ok image every time. We want to change that. Click fx button. In function field paste this formula:
=Switch(Fields!HealthState.Value="1","ok",Fields!HealthState.Value="2","warn",Fields!HealthState.Value="3","error")
This tells the field that basing on HealthState value it needs to get proper image from those three we imported. As I said you can make another switch option to put Uninitialized value there. When you accept and close all windows you should see an image icon in the field.
![clip_image001[26]](https://msdntnarchive.blob.core.windows.net/media/TNBlogsFS/prod.evol.blogs.technet.com/CommunityServer.Blogs.Components.WeblogFiles/00/00/00/96/24/metablogapi/4544.clip_image00126_04E7DEBA.png "clip_image001[26]")
When you click Preview above the design pane, you should see also proper report.
Now from the File menu just save this specific report and later import it to you SQL Reporting Server reports website (https://yourssrs/reports and choose Import File to a folder you like).
Happy Reporting! :)