Monitoring the Performance of your SAP SQL Database Files
Monitoring the Performance of Your SAP SQL Database Files
The driving force behind outstanding performance with SQL Server is a technique called Proportional Fill. This is how SQL Server writes to your file groups. When running SAP on SQL, only the PRIMARY file group can be used. The principal behind this technique is to write the data across all data files proportionally according to the amount of free space that is available for each file. Here are a few examples:
Example 1 – SQL needs to place data on three extents within your database
· File1 has 100 MB free space
· File2 has 100 MB free space
· File3 has 100 MB free space
· SQL Server will place one extent of data on all three files
Example 2 – SQL has 5 extents of data to be placed on the database
· File1 has 50MB free space
· File2 has 100MB free space
· File3 has 100MB free space
· 1 extent on File1 and 2 extents each on File2 and File3 because twice the freespace is available.
Example 1 provides the optimal solution in spreading out data across all files equally. Example 2 is not optimal because you have more data going into file2 and file3 than file1. This can cause hot spots on the disk and unbalanced I/O which can lead to poor performance.
When all of your files are full, SQL Server will extend one file (in round robin fashion) to allow the database to grow. Autogrowth must be enabled to make this happen. This is also not what you want because it will cause your database to be disproportionately filled. If you files are getting close to being filled then you should manually extend all files by the same amount to maintain the proper proportional fill. With SQL Server 2008, this behavior can be modified by trace flag 1117. (See SAP Service Marketplace note 1238993) If trace flag 1117 is turned on, then when SQL Server goes to extend that first data file, it will extend all data files, preventing a possible problem with proportional fill. This trace flag is only valid for SQL Server 2008.
So, how do you determine if you have a problem? Well, there are a few ways that we will look at. You can get a good idea through SAP using transaction DBACOCKPIT.
Validate Data File Sizes
Logon to SAP and then go to transaction DBACOCKPIT. You will the need to extend the SPACE folder and then select Overview. On the Display on the right side of the screen, select the FILES tab. See below.
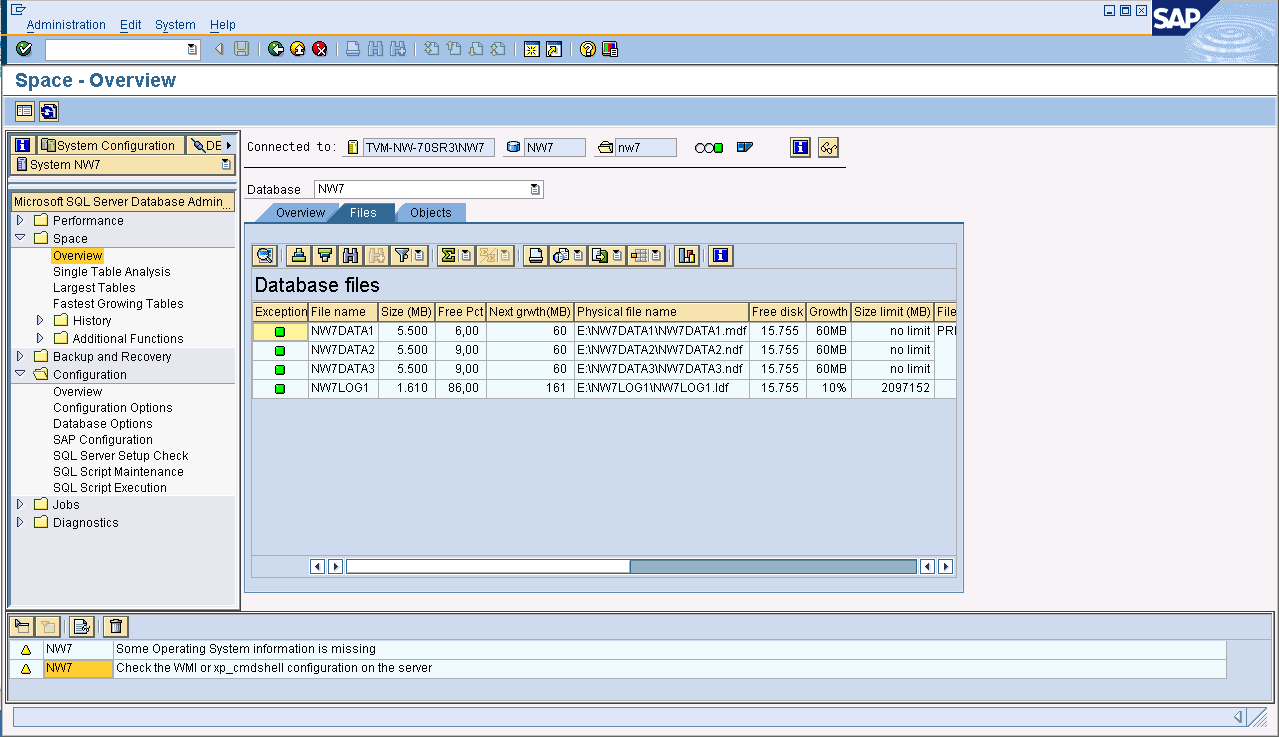
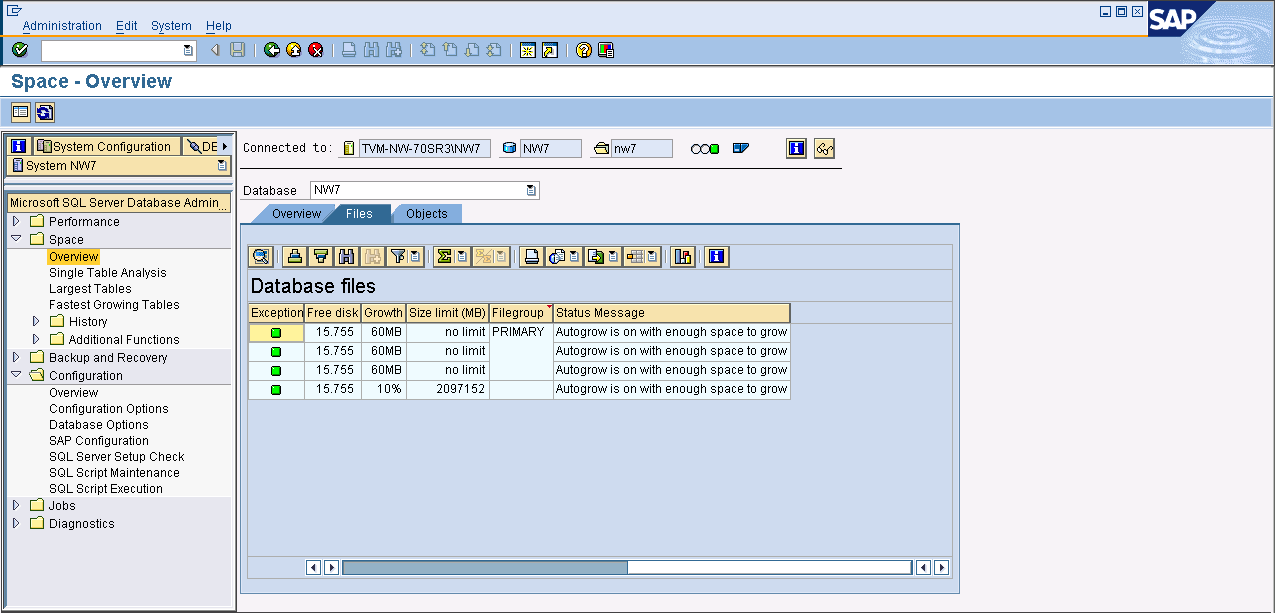
As you can see from the screenshot #1 above, all of the files are sized at 15.755 MB and the free pct is almost identical at 9.00. NW7DATA1 is at 6.00. This is probably because it has just grabbed some additional space and the other data files will expand very soon too. NWLOG1 is the Tlogs and not a part of this discussion. The second screenshot above is the right side of the screen and shows that AUTOGROWTH is on with enough space to extend.
This is an example of what you want to see. All of the files are the same size with about the same amount of free space.
Next you want to look at your ms/read and ms/writes. If proportional fill is working correctly then the reads across the datafiles should almost be identical and the same should be true of the writes. You can find this in the DBACOCKPIT transaction too. Expand the PERFORMANCE folder on the left and then double click I/O Performance.
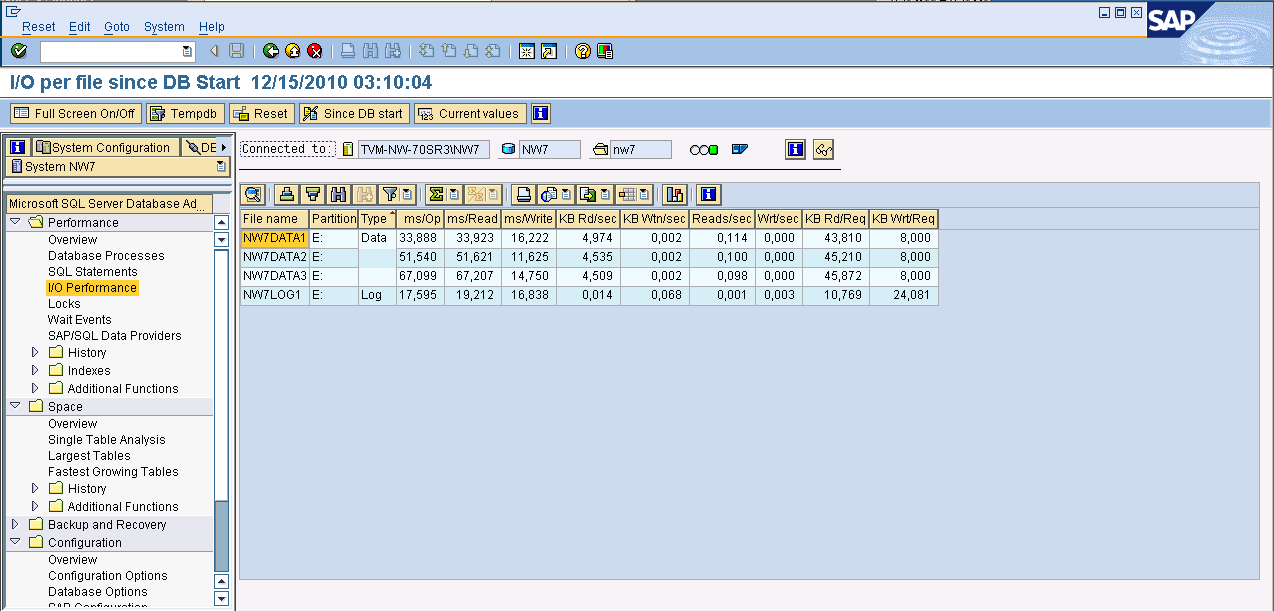
The above example is from a lab system and shows you what you don’t want to see. In the ms/Read column you can see the reads vary from 33,923 to 67,207. In the ms/Write column the numbers are closer, ranging from 11,625 to 16,222. Listed below is an export from a system that is running very well:
File |
Partition |
Type |
Ms/Op |
Ms/Read |
Ms/Write |
NW7_01 |
F: |
Data |
8.750 |
7.165 |
10.519 |
NW7_02 |
G: |
|
8.856 |
7.296 |
10.424 |
NW7_03 |
H: |
|
8.914 |
7.329 |
10.784 |
NW7_04 |
I: |
|
8.955 |
7.362 |
10.848 |
NW7_05 |
J: |
|
8.965 |
7.399 |
10.734 |
NW7_06 |
K: |
|
8.964 |
7.405 |
10.628 |
NW7_07 |
L: |
|
9.099 |
7.547 |
10.578 |
NW7_08 |
M: |
|
9.128 |
7.575 |
10.831 |
NW7_log |
T: |
Log |
2.104 |
9.055 |
1.740 |
Notice that the read and write times are very similar. This is exactly what you want to see.
That is two ways from within SAP that you can do a cursory check on your performance. If you would like to go a little deeper, there are a couple of SQL statements that can be executed to provide you with additional information. This information is covered in greater detail in a blog by Juergen Thomas called Proportional fill and how to check whether it works.
The first SQL statement will help you analyze your data files. It will look at the total number of reads and writes against all of your data files and then it will calculate the average number of reads/writes and compare that against the actual reads/writes. This will show you a percentage off each data file is from the average. Here is the SQL:
declare @avg_read bigint, @avg_write bigint
select @avg_read=avg(io.num_of_reads), @avg_write=avg(io.num_of_writes)
from sys.dm_io_virtual_file_stats(db_id(), -1) io, sys.database_files df
where io.file_id=df.file_id and df.type_desc = 'ROWS'
select io.file_id, df.name, io.num_of_reads, @avg_read as 'Avg Reads',
ceiling(((convert(decimal(10,0),num_of_reads)/@avg_read)*100)-100) as 'Percentage off Read Avg', io.num_of_writes, @avg_write as 'Avg Writes',
ceiling(((convert(decimal(10,2),num_of_writes)/@avg_write)*100)-100) as 'Percentage off Write Avg' from sys.dm_io_virtual_file_stats(db_id(), -1) io, sys.database_files df
where io.file_id=df.file_id and df.type_desc = 'ROWS'
You can execute this in SQL Management Studio. It will produce output that will look like the following:
File_Id |
Name |
Number of Reads |
Avg Reads |
Percentage off of Read Avg |
Number of Writes |
Avg Writes |
Percentage off of Write Avg |
1 |
NW7DATA1 |
52640796 |
43631430 |
21 |
2769624 |
3343182 |
-17 |
2 |
NW7DATA2 |
56839043 |
43631430 |
31 |
3251608 |
3343182 |
-2 |
3 |
NW7DATA3 |
57449320 |
43631430 |
32 |
3403255 |
3343182 |
2 |
4 |
NW7DATA4 |
59263332 |
43631430 |
36 |
3118588 |
3343182 |
-6 |
5 |
NW7DATA5 |
57061251 |
43631430 |
31 |
2911036 |
3343182 |
-12 |
6 |
NW7DATA6 |
58347537 |
43631430 |
34 |
2893586 |
3343182 |
-13 |
7 |
NW7DATA7 |
30797062 |
43631430 |
-29 |
4622042 |
3343182 |
39 |
8 |
NW7DATA8 |
30716323 |
43631430 |
-29 |
4616088 |
3343182 |
39 |
This is an example of a system that has some problems. In a system that is operating normally, you would expect the reads/writes to be very close in number and the percentages to be -2 to 2. This system had files that had been added, but the free space was not adjusted and proportional fill was out of sync.
The next check is a stored procedure that will analyze a table and see how it is allocated across your data files. Once again, you will execute this within SQL Server Management Studio. You will need to create the stored procedure and then execute it with the table you have selected. I would recommend that you use one of the largest tables in your database. You can easily determine this in DBACOCKPIT, expand the SPACE folder and double click Largest Tables.
Here is the stored procedure code:
drop procedure sp_tablepart
go
create procedure sp_tablepart @tname sysname as
begin
set nocount on
declare @extentinfo9p table (file_id int, page_id int, pg_alloc int, ext_size int,
obj_id int, index_id int, partition_number int, partition_id bigint, iam_chain_type varchar(20), pfs_bytes varbinary(8))
declare @exec_statement varchar(512), @tname2 sysname, @dbid int, @fname sysname, @page_count bigint
set @dbid=db_id()
set @tname2 = quotename(@tname)
set @exec_statement = 'dbcc extentinfo(' + convert(varchar,@dbid) + ',' + @tname2 + ') with no_infomsgs'
insert into @extentinfo9p exec (@exec_statement)
select @page_count = SUM(pg_alloc) from @extentinfo9p
select distinct (ei.file_id) as 'File ID', df.name as 'Name',
fg.name as 'Filegroup Name', SUM(ei.pg_alloc) as 'Pages allocated',
ROUND(((convert(decimal,SUM(ei.pg_alloc))/convert(decimal,@page_count))*100),1) as Percentage
from @extentinfo9p ei, sys.database_files df, sys.filegroups fg
where ei.file_id = df.file_id and df.data_space_id=fg.data_space_id
group by ei.file_id, df.name, fg.name order by ei.file_id
end
To execute the stored procedure enter this command:
sp_tablepart ‘schema.tablename’
Example: sp_tablepart ‘nw7.BSIS’
You will receive output similar this:
File ID |
Name |
Filegroup Name |
Pages allocated |
Percentage |
1 |
Data1 |
PRIMARY |
16928 |
3 |
3 |
Data2 |
PRIMARY |
17327 |
3 |
4 |
Data3 |
PRIMARY |
17154 |
3 |
5 |
Data4 |
PRIMARY |
17430 |
3.1 |
6 |
Data5 |
PRIMARY |
18418 |
3.2 |
7 |
Data6 |
PRIMARY |
17703 |
3.1 |
8 |
Data7 |
PRIMARY |
18808 |
3.3 |
… |
… |
… |
… |
… |
30 |
Data29 |
PRIMARY |
17825 |
3.1 |
31 |
Data30 |
PRIMARY |
17751 |
3.1 |
32 |
Data31 |
PRIMARY |
17852 |
3.1 |
33 |
Data32 |
PRIMARY |
17545 |
3.1 |
This is an example of a table that has been proportionally distributed across all data files and is exactly what you are looking for.
Correcting Proportional Fill Issues
The best way to correct any problems you might be experiencing is by performing a homogeneous system copy. You will find guides on the SAP Service Marketplace to help you with this. Once you have exported your database, you would then re-create your data files ensuring that they are all the same size. Once you perform the import, your data should be proportionally distributed. This is a very time consuming process and many of your will not have the luxury of getting this much down time.
Another alternative is to re-size your existing data files. Make sure that each and every file has the same amount of freespace. This will cause SQL Server to begin to proportionally fill the data files again. It will not correct what has already been done.
All in all, if you setup and maintain your data files correctly, this should not be an issue. If you are running SQL Server 2008 and higher, set trace flag 1117. I hope this blog will help you in maintaining excellent performance on your system.