Performance Overhead of Nested Virtualization on Windows Server 2016 Technical Preview 4
Nested virtualization is running virtualization inside a virtualized environment. On Windows Server 2016 Technical Preview 4, you may run the Hyper-V server role inside a virtual machine. For more information regarding nested virtualization please visit the link below.
https://msdn.microsoft.com/en-us/virtualization/hyperv_on_windows/user_guide/nesting
No doubt, nested virtualization is extremely useful, especially for the engineering group who need the access the physical host. I don't want to list value proposition those marketing stuff. Just gave an example here. With Nested Virtualization, I retired all the old servers. Previously I keep them just because I need some Hyper-V host in my environment. Now I only need to keep few powerful servers
When adopting nested virtualization, besides the knowns issues mentioned in the above link, another concern is performance overhead. Virtualization would have some performance overhead. Then how about virtualization inside a virtualized environment? Is the performance acceptable? In this blog I will use some simple tests and address those concerns.
Test Environment:
------------------------
Host: HP Z840 Workstation
- E5-2686v3 (2.0GHz, 18 Cores, 36 threads) X2
- 256GB DDR4 Memory
- Data Drive: Local Simple Storage Space with 5 HITACHI SSD800MM 800GB SSDs
- NIC: Mellanox Connect-3 10Gb
VM:
- 2.0GHz X16
- 64GB DDR4 Memory
- Data Drive: 128GB Fixed VHD on the above simple Space.
- NIC: 10Gb
Nested VM
- 2.0GHz X8
- 16GB DDR4 Memory
- Data Drive: 128GB Fixed VHD inside the above Data VHD
- NIC: 10Gb
Performance Overhead: Processor
------------------------
When we are talking about the performance of a processor, actually it means lots of thing. In this blog, I just use Fritz Chess Benchmark, which is basically test the processor number crunching speed (the large-scale processing of numerical data). Its version 4.3 can support up to 16 cores. In my test, I limited it to 8 cores.
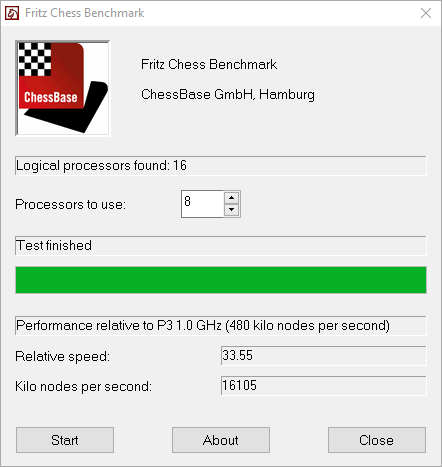
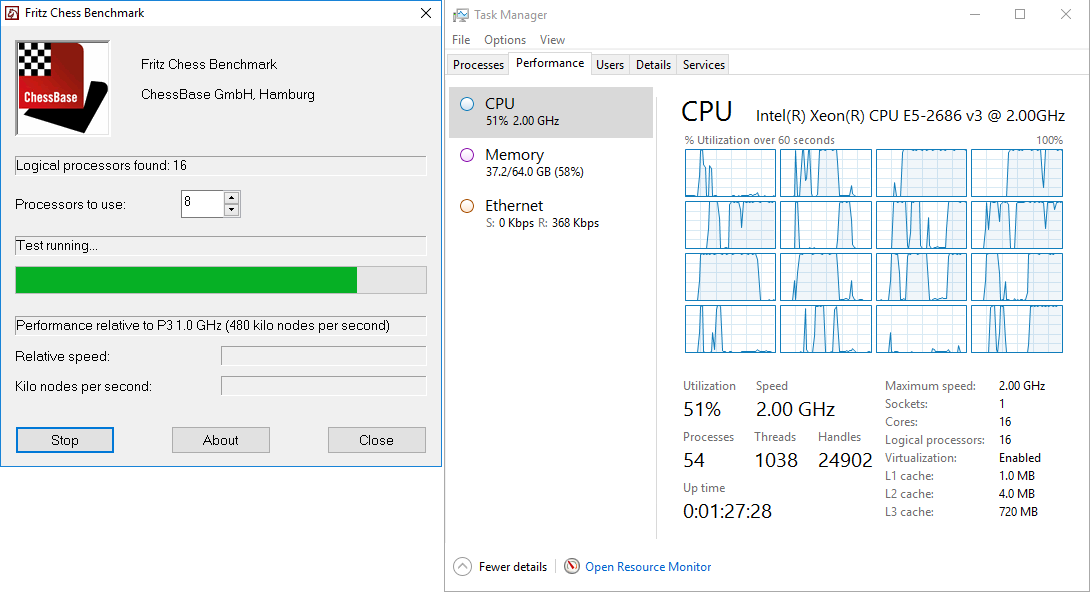
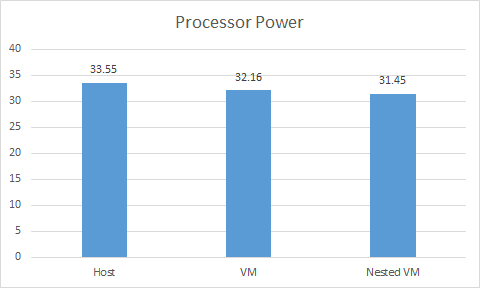
1. Run Fritz Chess Benchmark from Host. As you could see from the picture below, the benchmark tool stress 8 of my cores.
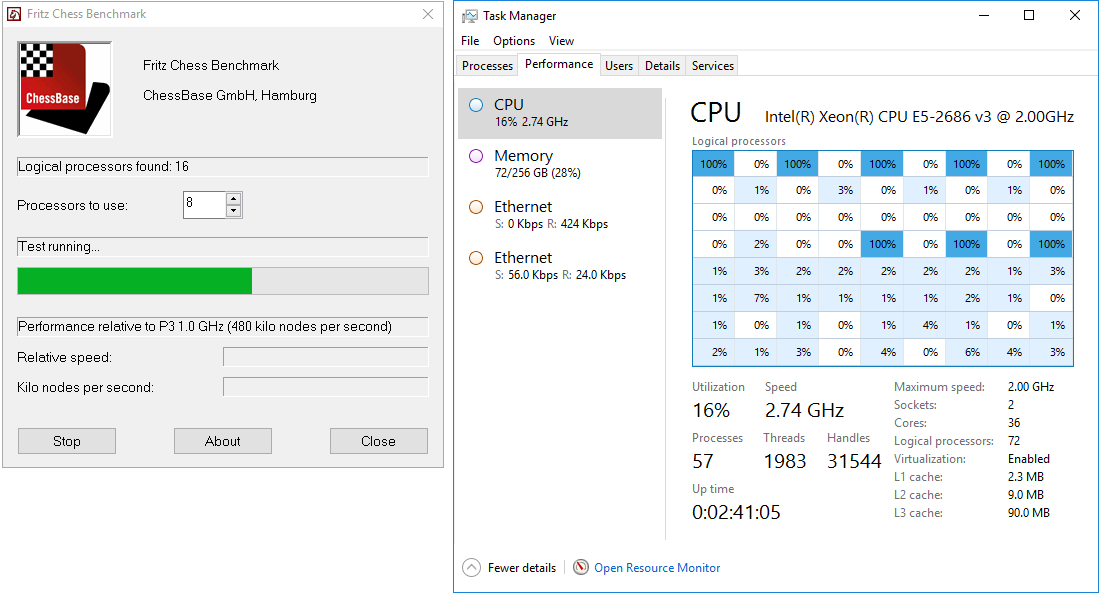
The test result is 33.55, which mean basically its number crunching speed is faster than 33 Intel P3 1.0GHz processor.
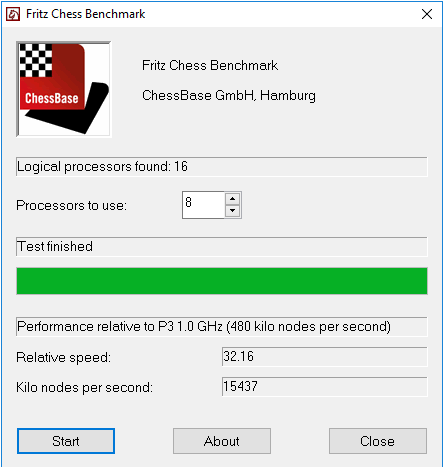
2. Run Fritz Chess Benchmark from VM.
Test result is 32.16
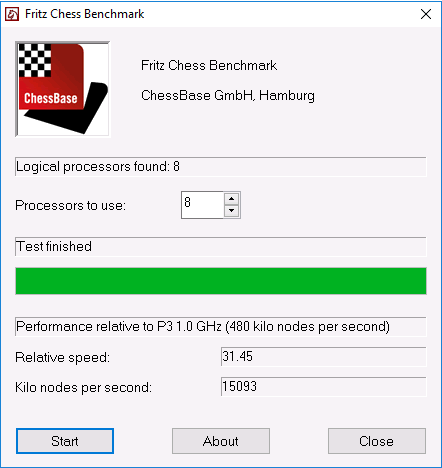
3. Run Fritz Chess Benchmark from Nested VM.
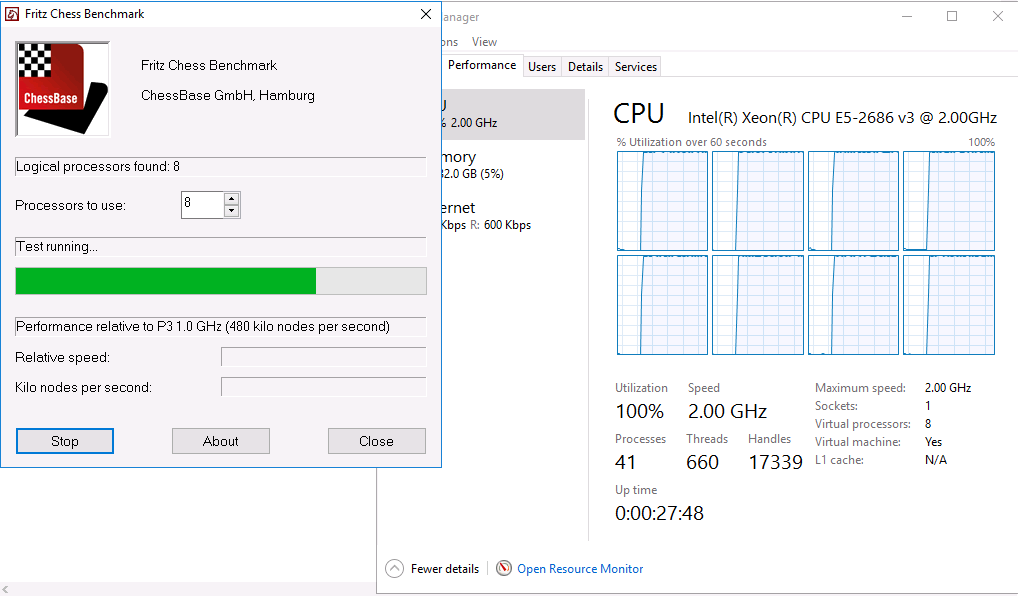
Test result is 31.45.
Performance Overhead: Network IO
------------------------
In the test I have another server with the same 10Gb NIC (Mellanox Connect-3). Its IP address is 192.168.252.12. I run the command on that machine.
ntttcp.exe -r -m 8,*,192.168.252.12 -rb 2M -a 16 -t 15
Then I run the following command on Host, VM and Nested VM.
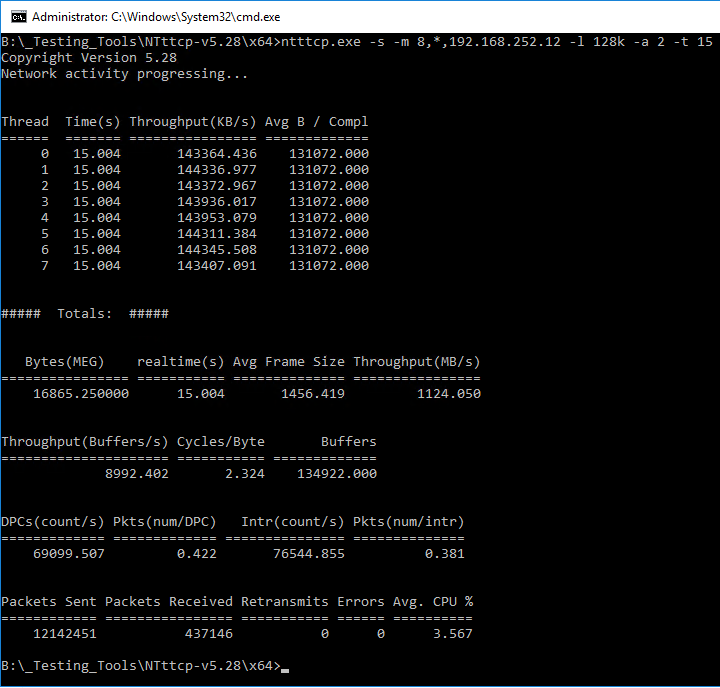
ntttcp.exe -s -m 8,*,192.168.252.12 -l 128k -a 2 -t 15
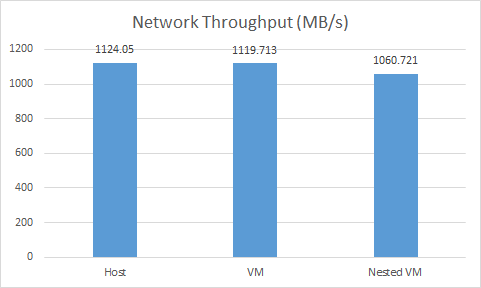
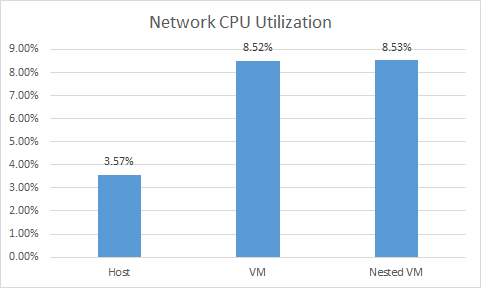
1. Run NTTTCP on the host. The throughput is 1124.05MB/s and CPU utilization is 3.567%
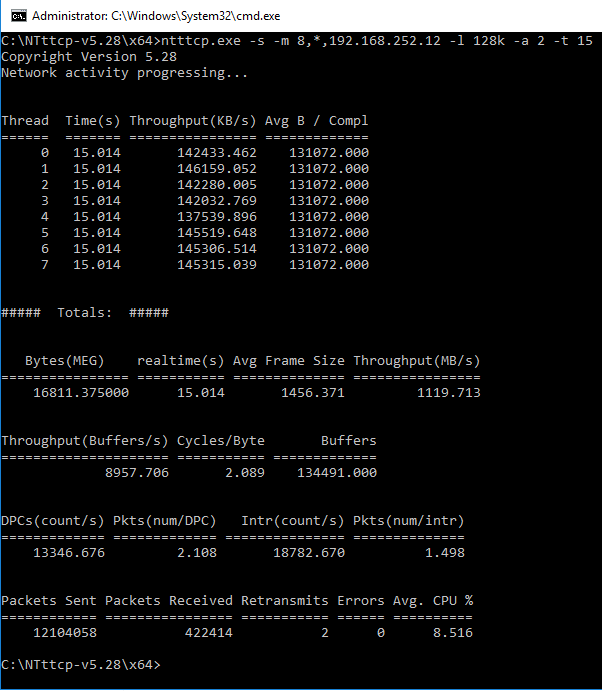
2. Run NTTTCP in the VM. The throughput is 1119.713MB/s and CPU utilization is 8.516%
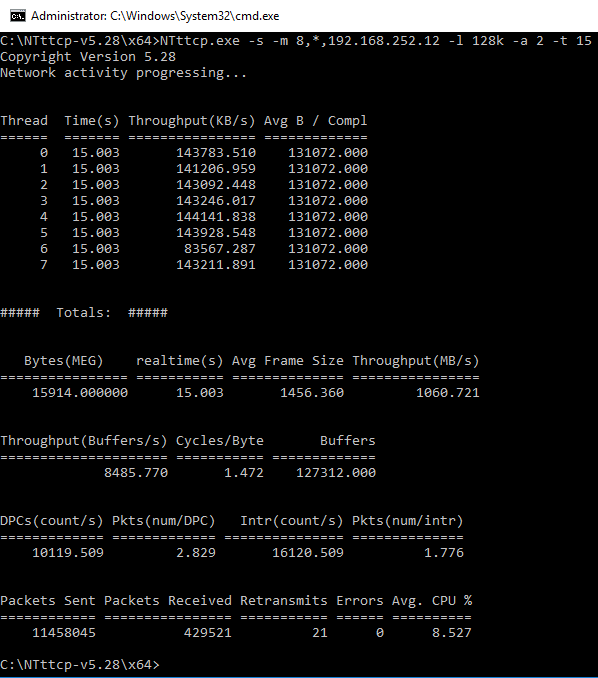
3. Run NTTCP in the nested VM. The throughput is 1060.721MB/s and CPU utilization is 8.527%.
Performance Overhead: Storage IO
------------------------
Run the following command on Host, VM and Nested VM to test data drive's 4KB random write performance.
fio.exe --name=4kwritetest --rw=randrw --direct=1 --iodepth=20 --blocksize=4k --ioengine=windowsaio --filename=\\.\PhysicalDrive1 --numjobs=16 --refill_buffers --norandommap --randrepeat=0 --rwmixread=0 --group_reporting --runtime=1800 --thread
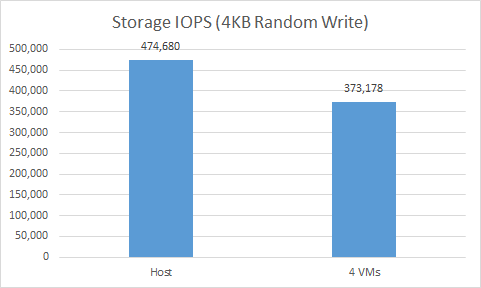
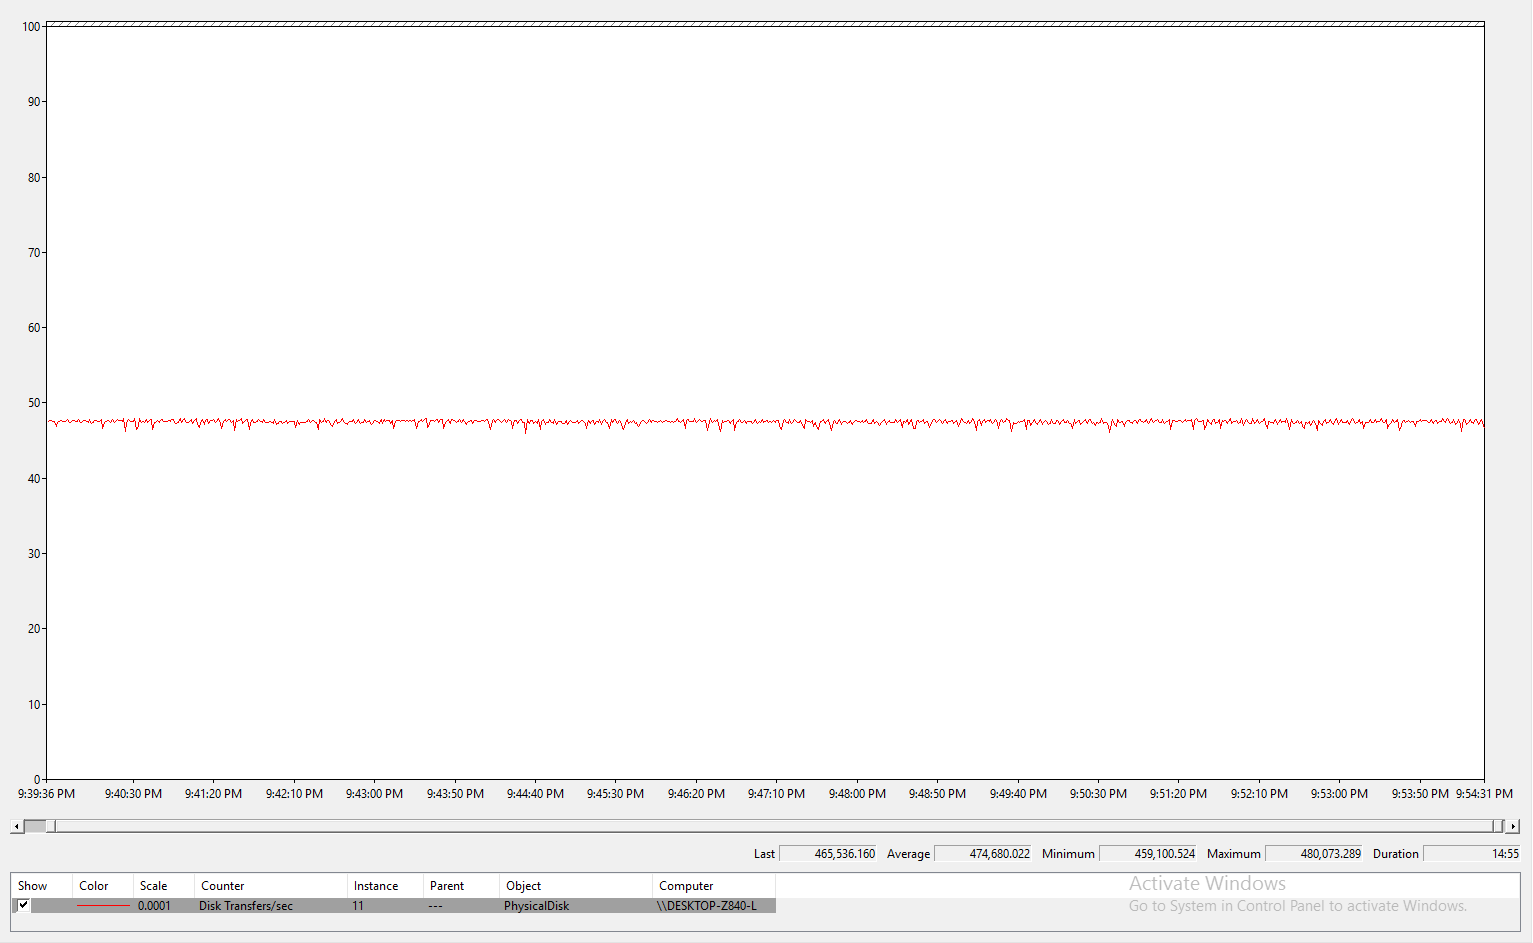
1. Run FIO on the host. The simple storage space can provide around 465,536 IOPS.
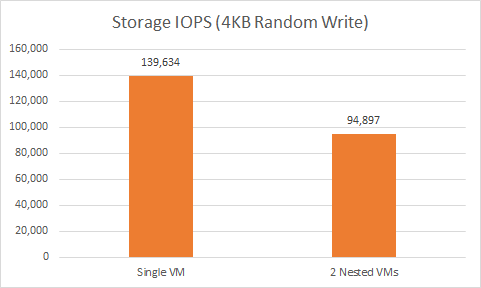
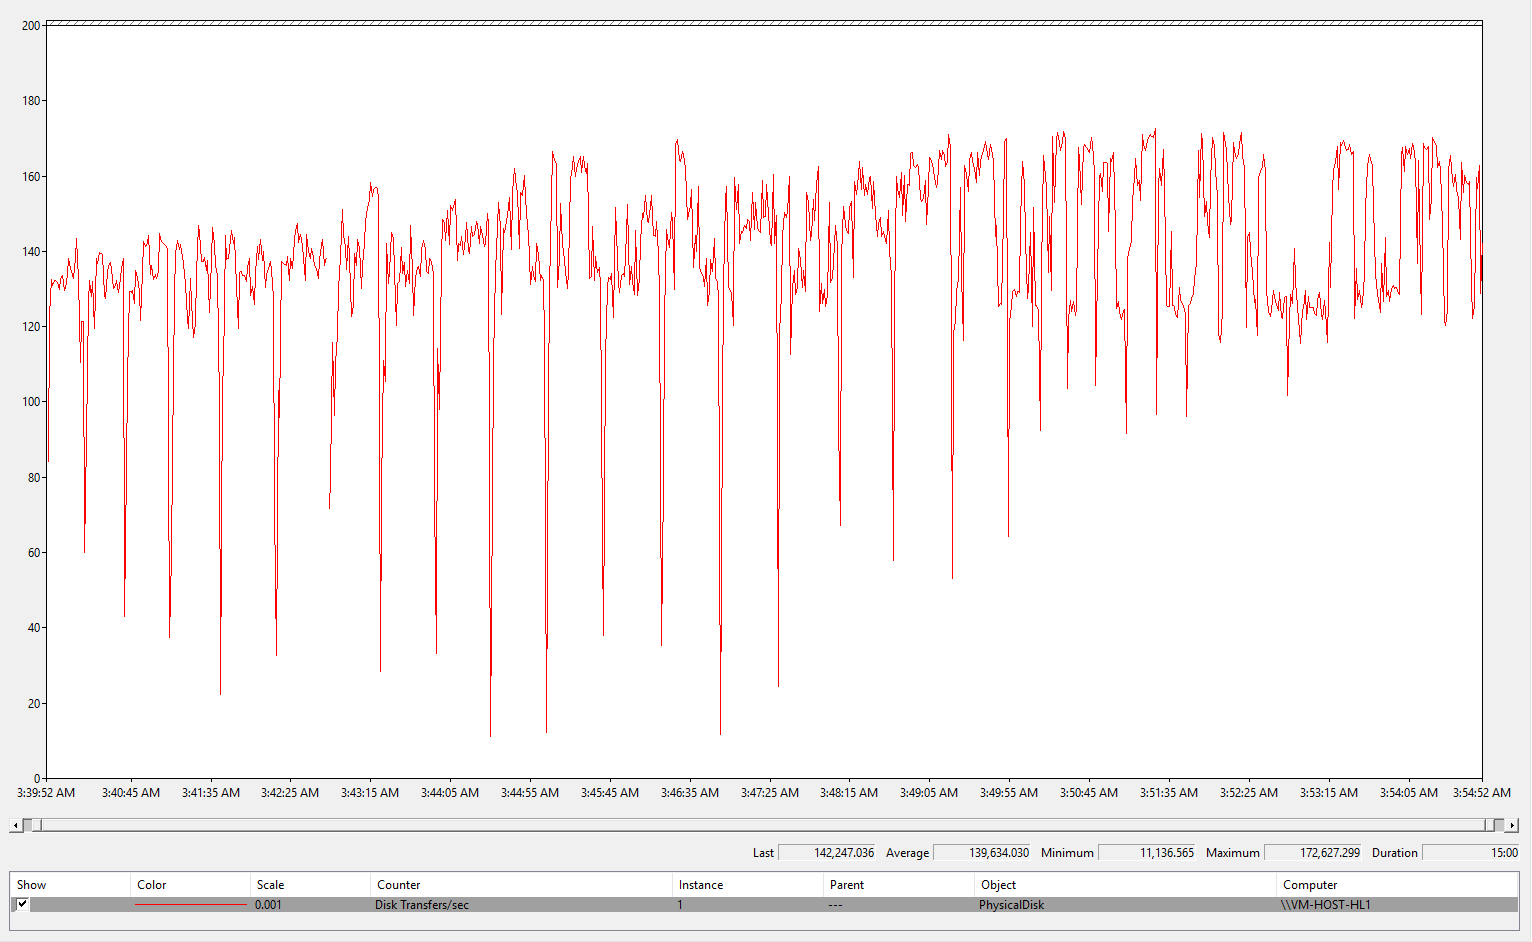
2. Run FIO in one VM, the result is 139,634 IOPS.
Then run FIO in the 4 VMs simultaneously, those 4 VMs are all on the above simple storage space. I got 373178 IOPS in total.

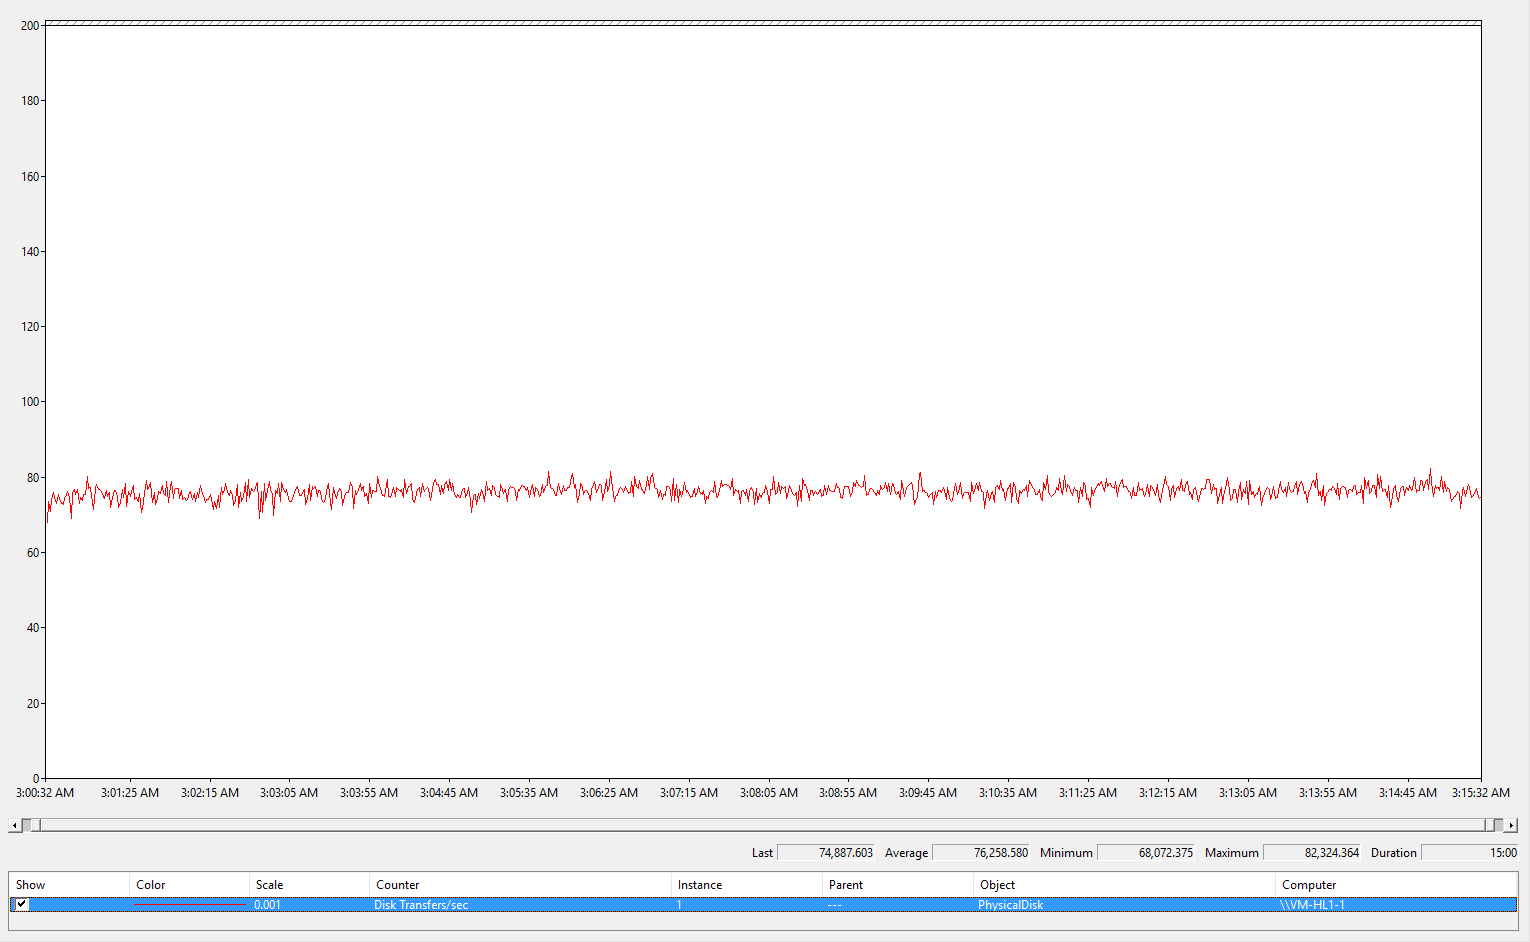
3. Run FIO in single nested VM. The result is 76,259 IOPS.
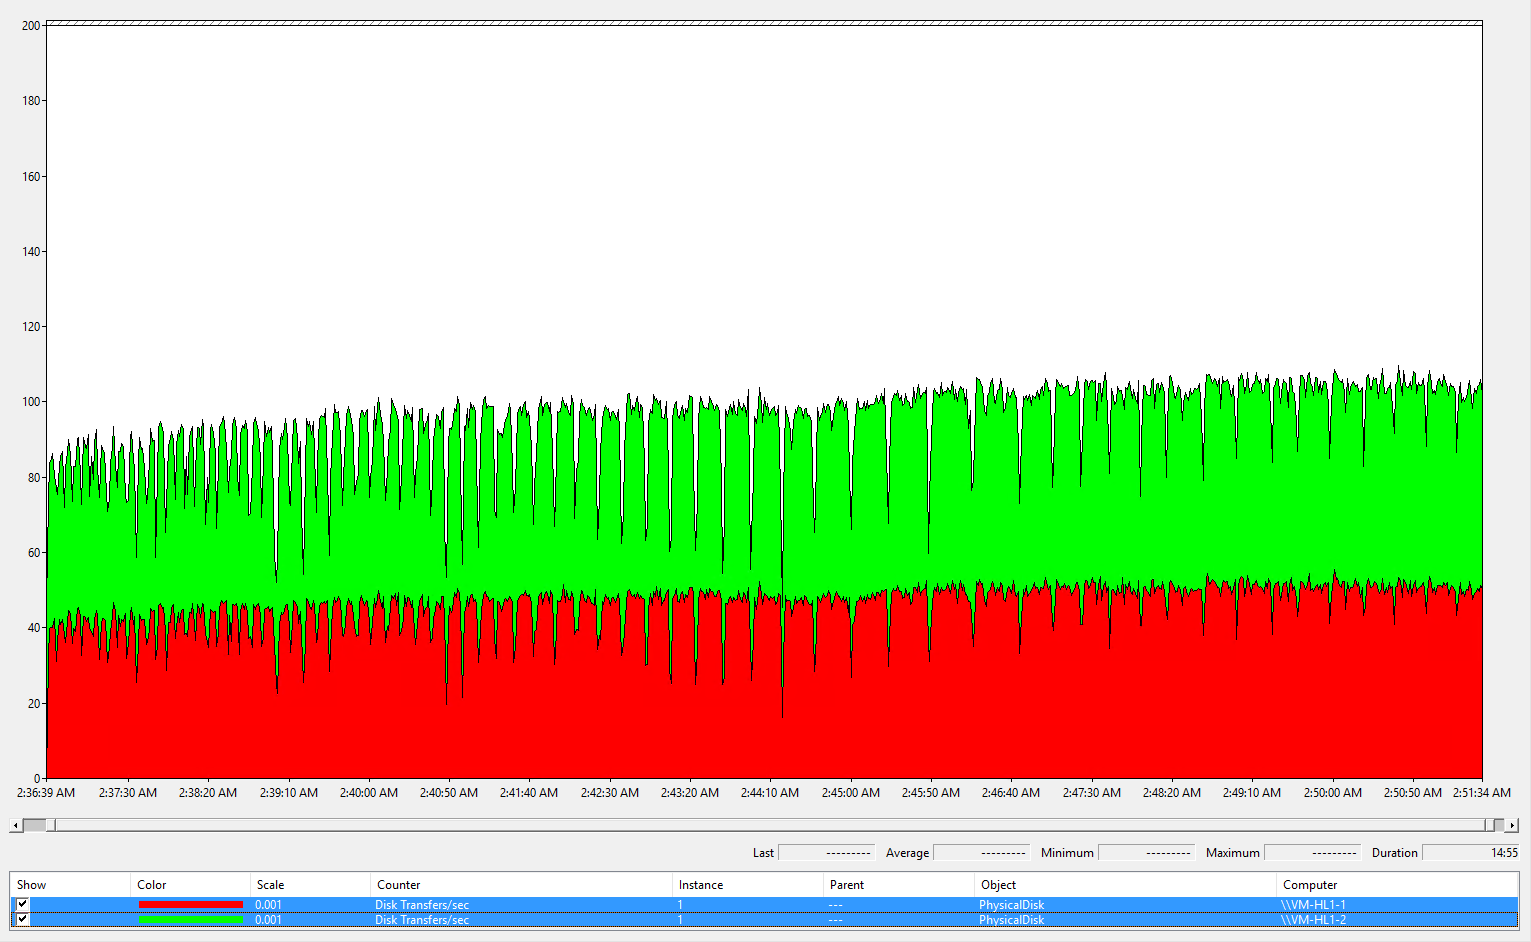
Then run FIO in the 4 VMs simultaneously, those 4 VMs are all on the above simple storage space. I got 94,897 IOPS in total.
Summary:
-------------------------------
Based on the above test results, we could see in the first layer virtualization, there is only around 4.14% CPU performance drop. The nested virtualization introduced the additional 2.21% performance drop. Not too much.
In terms of networking subsystem we could see network overhead (Throughput and CPU utilization) is not huge either.
However for Storage Sub-system, we could see the first layer virtualization, the storage performance penalty is around 21.38%. The second layer virtualization introduce additional 32.04% performance overhead. Obviously prepare a good storage is the key to have better performance in nested virtualization environment.