Understand Storage Space Tiering in Windows Server 2012 R2
Background
Although Windows Server 2012 R2 has already released for more than 2 years, from time to time people still has questions regarding the Storage Space Tiering in it. For example:
- Storage Space Tiering in Windows Server 2012 R2 is based on file or disk block?
- What's the write back cache in Storage Space Tiering? Why 1GB and why I could not specify its size when I create virtual disk from UI?
- When will the data write to SSD and when will write to HDD?
- Why sometimes the performance of my tiered storage is perfect while sometimes is extremely bad just like pure HDD array.
- Is there any way to monitor the SSD tier, HDD tier and Write Back Cache to make sure they're working as expected?
To answer the above questions, I wrote this blog and explain how Storage Space Tiering works. I will also prove it with real test case.
If you're not familiar with Storage Spaces or Storage Spaces Tiering, you may review the following links:
Storage Spaces Overview
Step-by-step for Storage Spaces Tiering in Windows Server 2012 R2
Storage Spaces - Designing for Performance
Monitor Storage Tiers Performance in Windows Server 2012 R2
Write Back Cache
A write-back cache backed by SSDs minimizes the impact of random writes—In addition, a 1 GB write-back cache backed by SSDs reduces the latency of random writes, which increases the overall throughput performance of the storage.
This typically delivers very efficient storage management with little or no intervention on your part. That's why Storage Space doesn't enable use to modify it thru UI. However, if you need to adjust the number to get the performance you want for a specific workload, you may specify the write back cache size when you create virtual disk thru PowerShell cmdlets. For example:
Get-StoragePool "Pool" | New-VirtualDisk -FriendlyName "VD" -ResiliencySettingName Simple -WriteCacheSize 2GB -UseMaximumSize
Behavior of Storage Space Tiering
Here are the data flows start from the storage pool and virtual disk got provisioned.
- After virtual disk with tiered storage got provisioned, the virtual disk would have certain capacity for each tier (SSD and HDD). At that point of time, both of the tiers are empty. When there is new data coming in, the data would write to SSD Tier directly until SSD Tier is full.
- After SSD Tier is full, new incoming random writes will first go to write back cache and then flush to HDD tier. If write back cache is full (be default each virtual disk has only 1GB write back cache), then the data will be written to HDD directly.
- At the same time, Write Back Cache will continue flush data to HDD tier.
- When Write Back Cache is available again, it would handle new incoming random writes.
Storage Tiers Optimization
(Some of the content below come from the above papers.)
If you're using tiered storage spaces in Windows Server 2012 R2, Windows is automatically optimizing your storage performance by transparently moving the data that's accessed most frequently to your faster solid-state drives (the SSD tier) and switching out less active data to your less expensive hard disk drives (the HDD tier).
Storage tiers optimization is a two-part process, as shown below:
- Over the course of the day, Storage Spaces creates a heat map of the data based on how often each piece of data is accessed. (1)
- During its nightly run (at 1:00 a.m., by default), the Storage Tiers Optimization task moves the most frequently accessed ("hot") data to your faster solid-state drives (the SSD tier) and the "cooler" data to the less expensive hard disk drives (the HDD tier). (2)

Optimization moves data, not files—The data is mapped and moved at a sub-file level. So if only 30 percent of the data on a virtual hard disk is "hot," only that 30 percent moves to your solid-state drives.
Verify the Storage Space Tiering Behavior
Test Environment:
DELL T7600 Workstation
- Processor: Intel Xeon E5-2689 2.6GHz x2 (16 cores, 32 threads)
- Memory: 16GB DDR3 x16 (256GB)
- Boot Drive: Seagate 600PRO 480GB SSD x1
- SSD Tier: SMART Storage System Optimus SAS 200GB SSD x4
- HDD Tier: Seagate Savvio 10K.3 SAS 300GB HDD x4
Test Case 1: Write to Empty Storage Space.
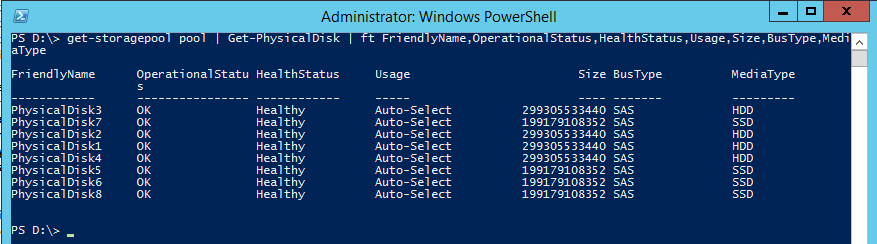
1. Create a storage pool with the above 4 SSDs and 4 HDDs
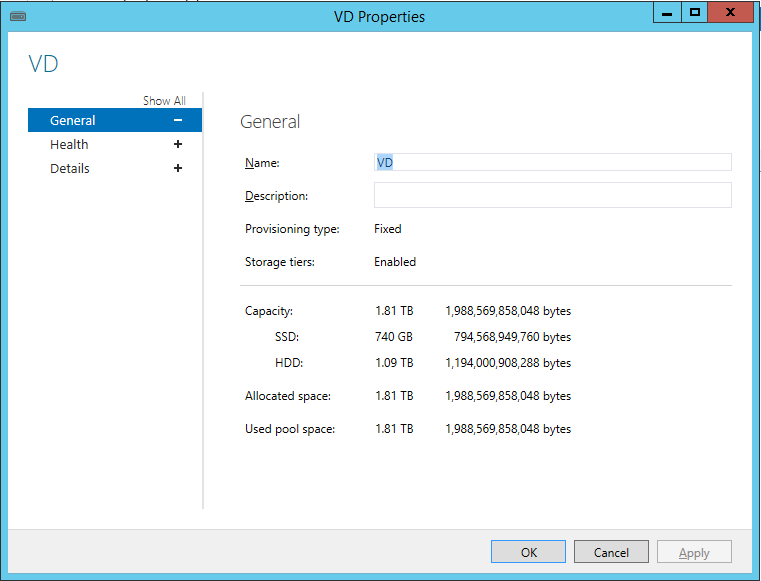
2. Create a virtual disk with tiered storage. In this case, SSD Tier has 740GB capacity.
3. Use Diskspd.exe to stress test the above virtual disk.
.\diskspd.exe -c100G -d300 -w100 -t16 -o20 -b4K -r -h -L -D E:\IO1.dat
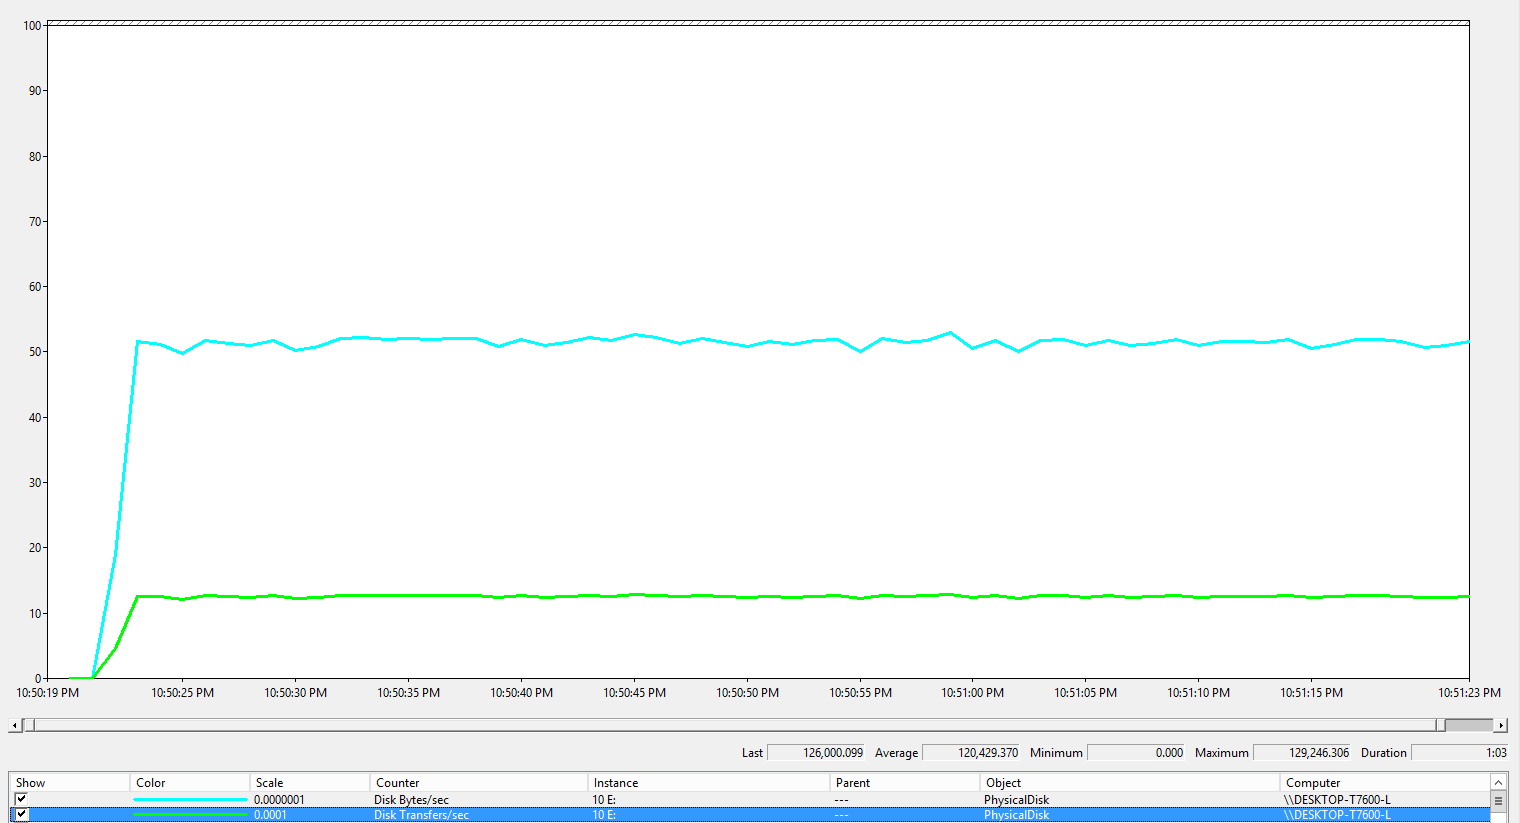
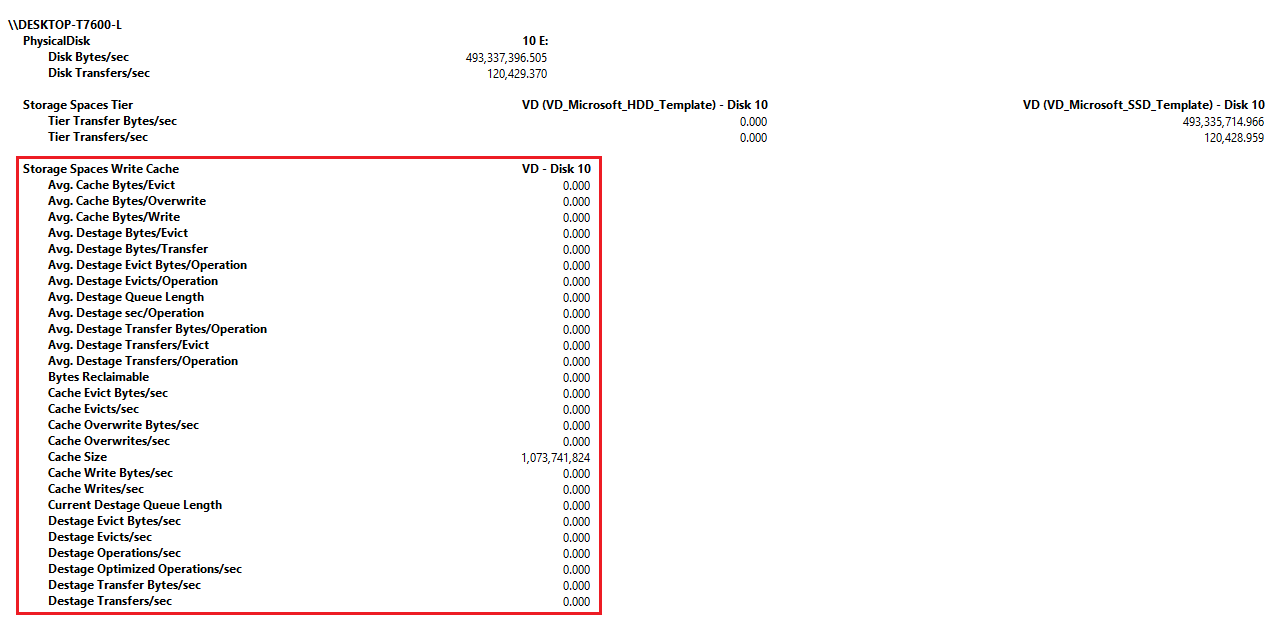
From the performance log below we could see test result is pretty good, average IOPS is around 120,429. Basically that's expected performance from 4 Optimus SAS 200GB SSD drives.
If we look at the performance of each tier, we could see all of the IOs are in SSD tier.
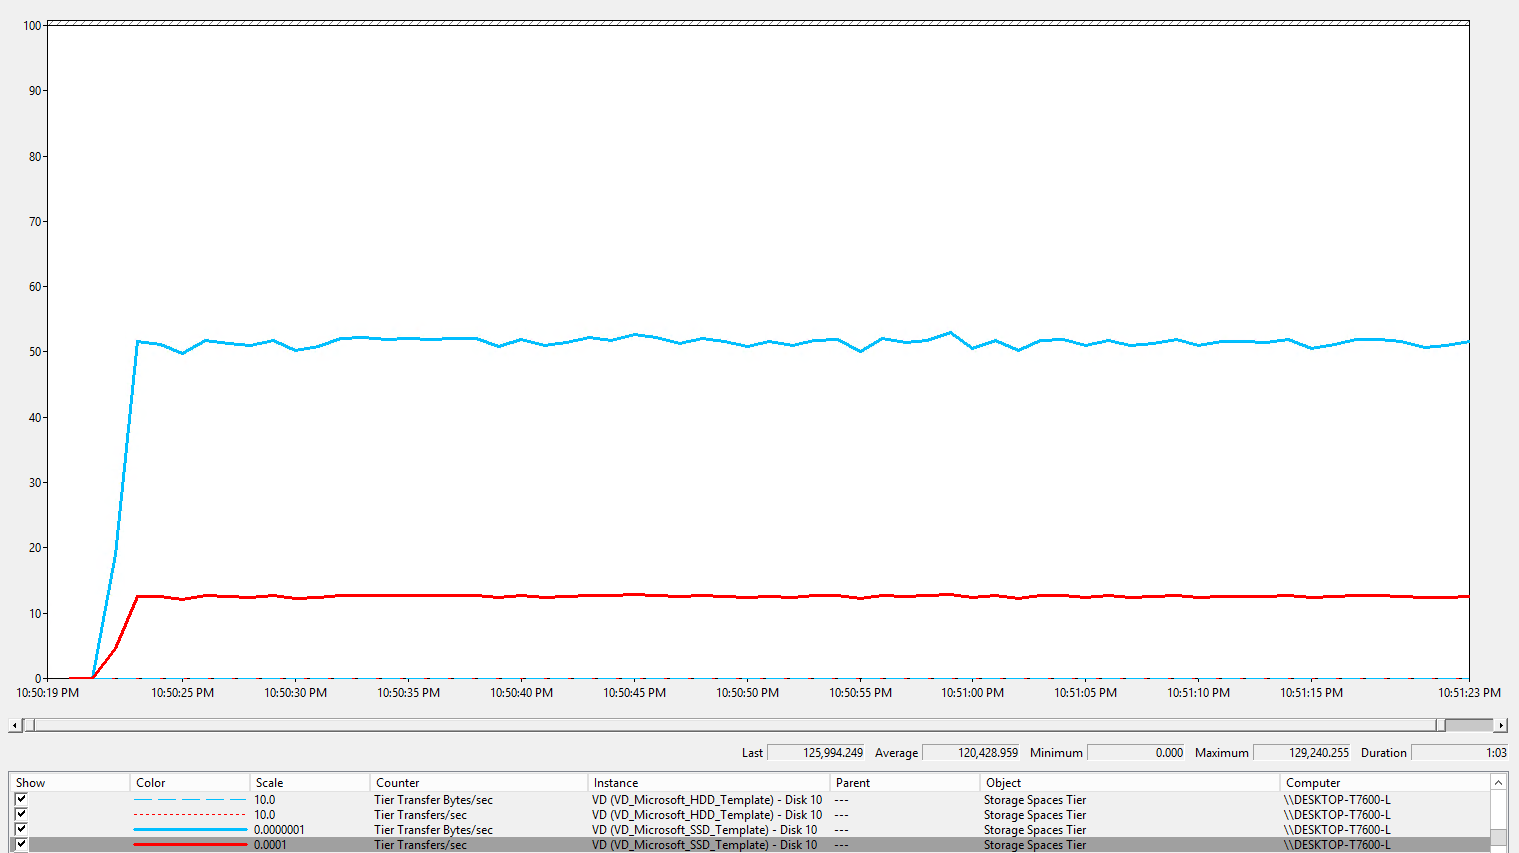
In addition, in the whole test, we didn't use any write back cache.
Test Case 1: Write to Used Storage Space
1. Create some large files on the above virtual disk. Total size is large than the capacity of SSD tier (740GB).
fsutil file createnew E:\file1.dat (745GB)
fsutil file createnew E:\file2.dat (500GB)
2. Run the same stress test again.
.\diskspd.exe -c100G -d300 -w100 -t16 -o20 -b4K -r -h -L -D E:\IO2.dat
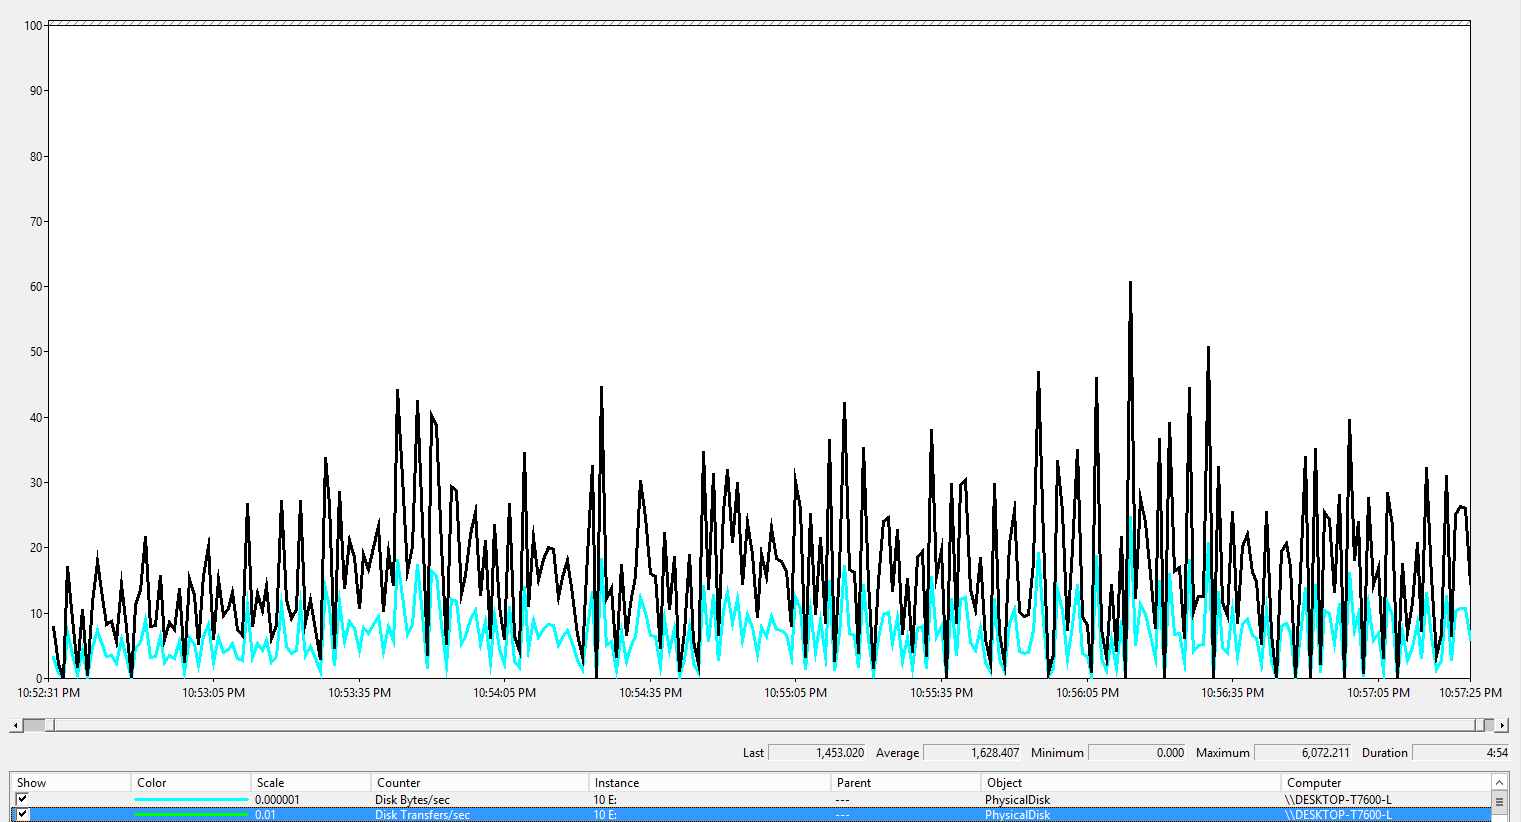
Now this time the performance is not good. Average IOPS is only around 1,628, which is close to what 4 10K rpm SAS HDD can provide.
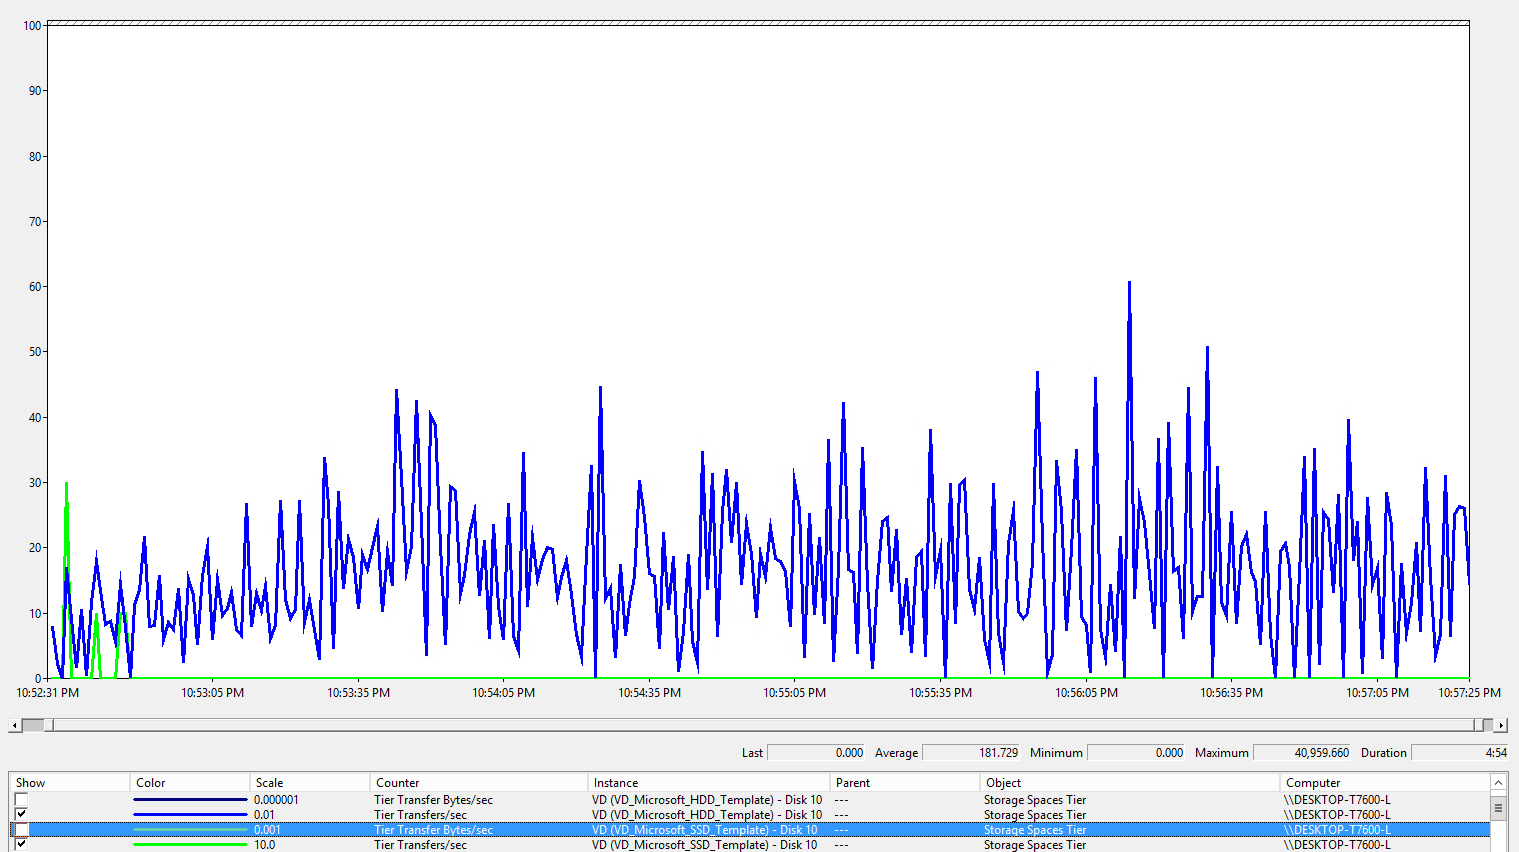
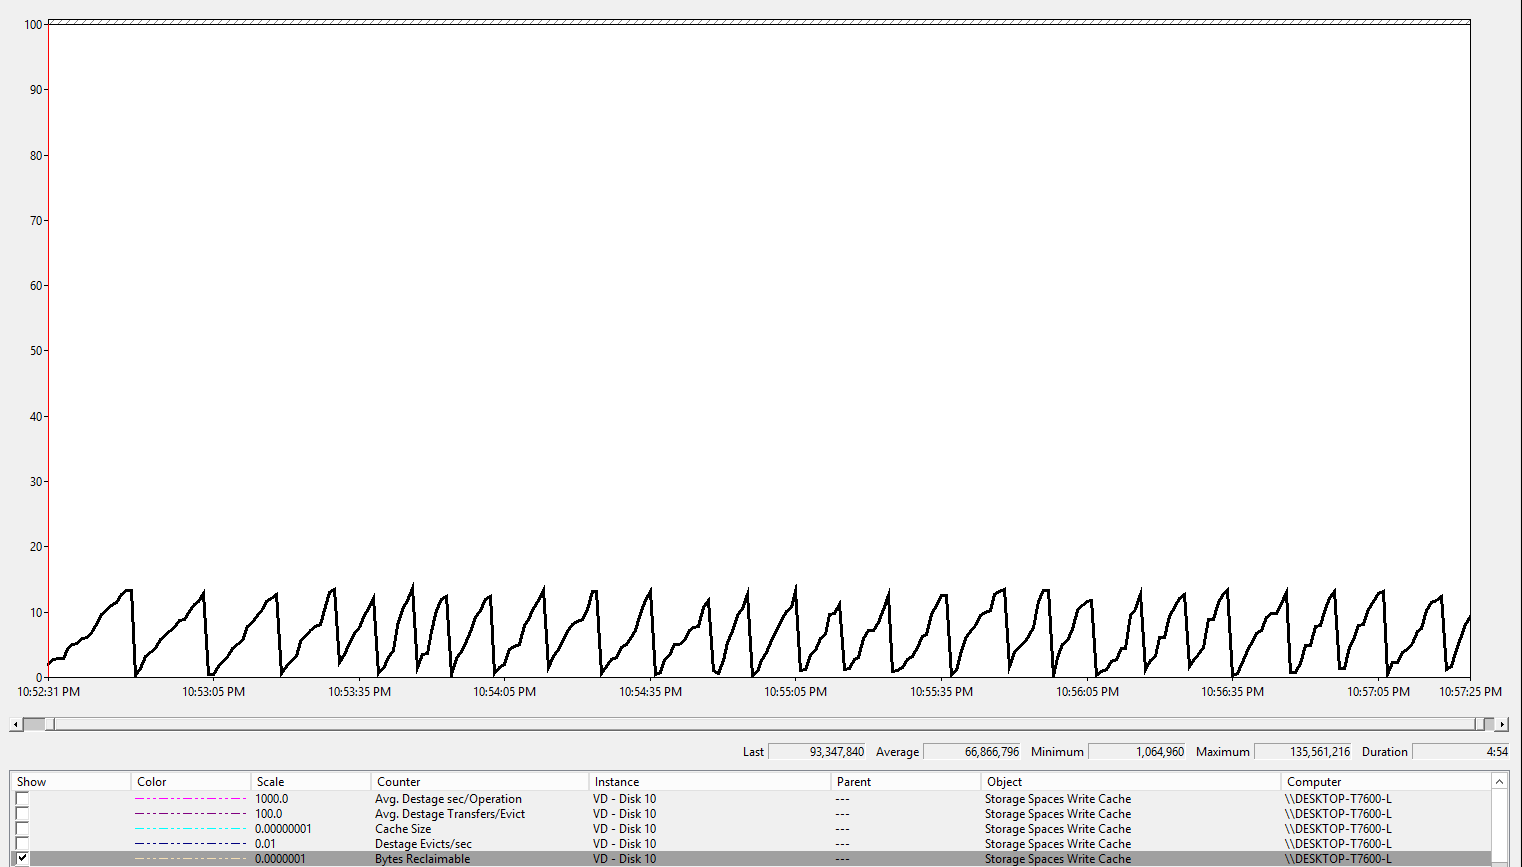
What happened? The picture below tell us almost all the IO are in HDD tier.
This time, write back cache had been used.
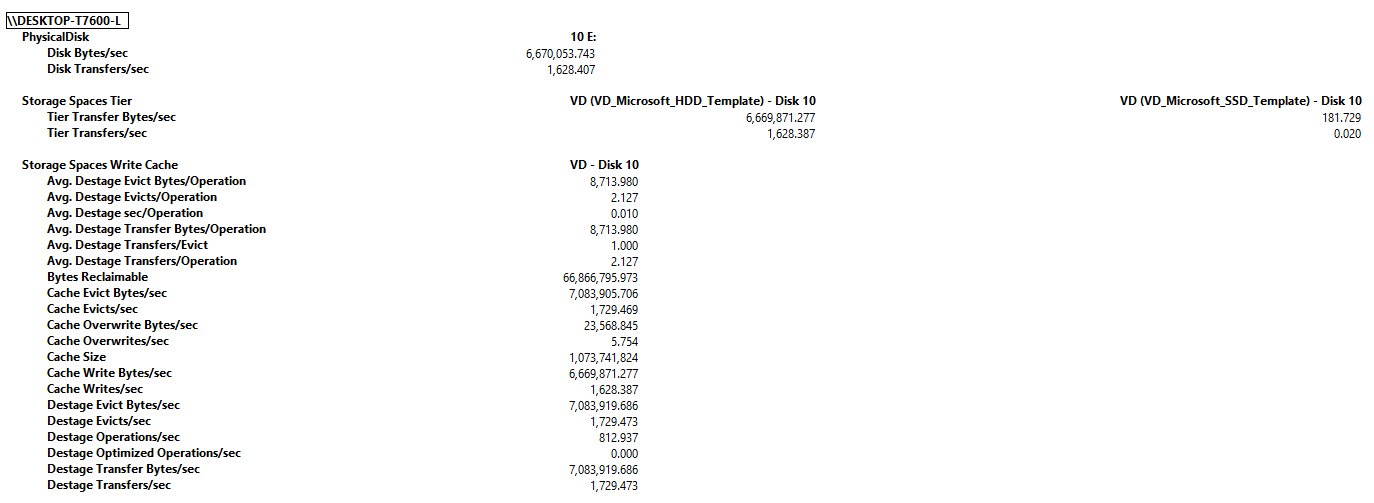
Pattern of available cache space told us that 1GB write back cache continues being fill in and flush out.
Test case 3: After Storage Optimization
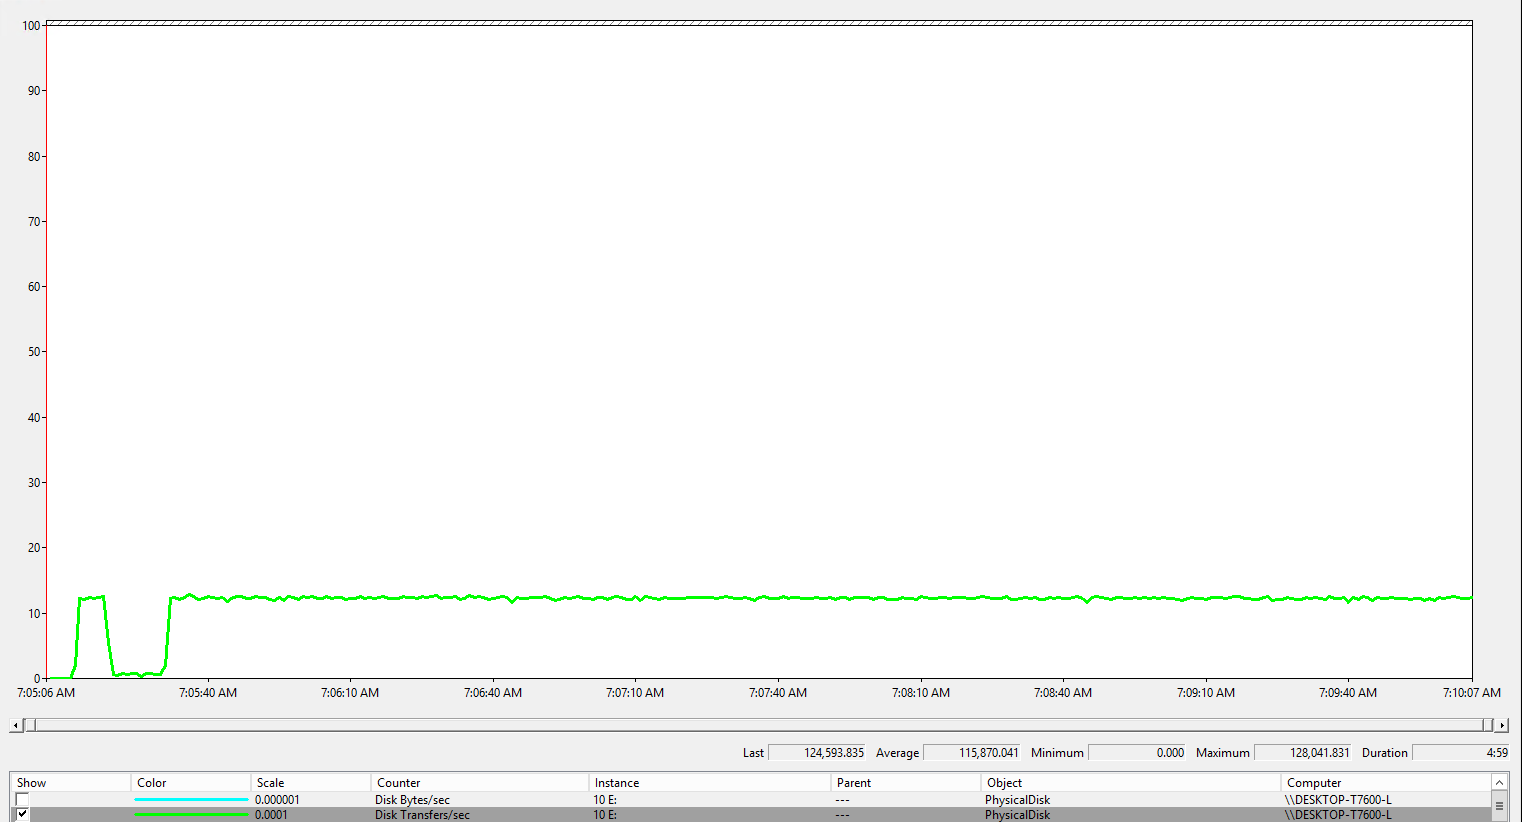
As mentioned in the paper Monitor Storage Tiers Performance in Windows Server 2012 R2 there is a scheduled task called "Storage Tiers Optimization", which will move the data that's accessed most frequently to your faster solid-state drives (the SSD tier) and switching out less active data to your less expensive hard disk drives (the HDD tier).
Then what happened after storage tiers optimization? We run the same test script and stress the same test file.
.\diskspd.exe -c100G -d300 -w100 -t16 -o20 -b4K -r -h -L -D E:\IO2.dat
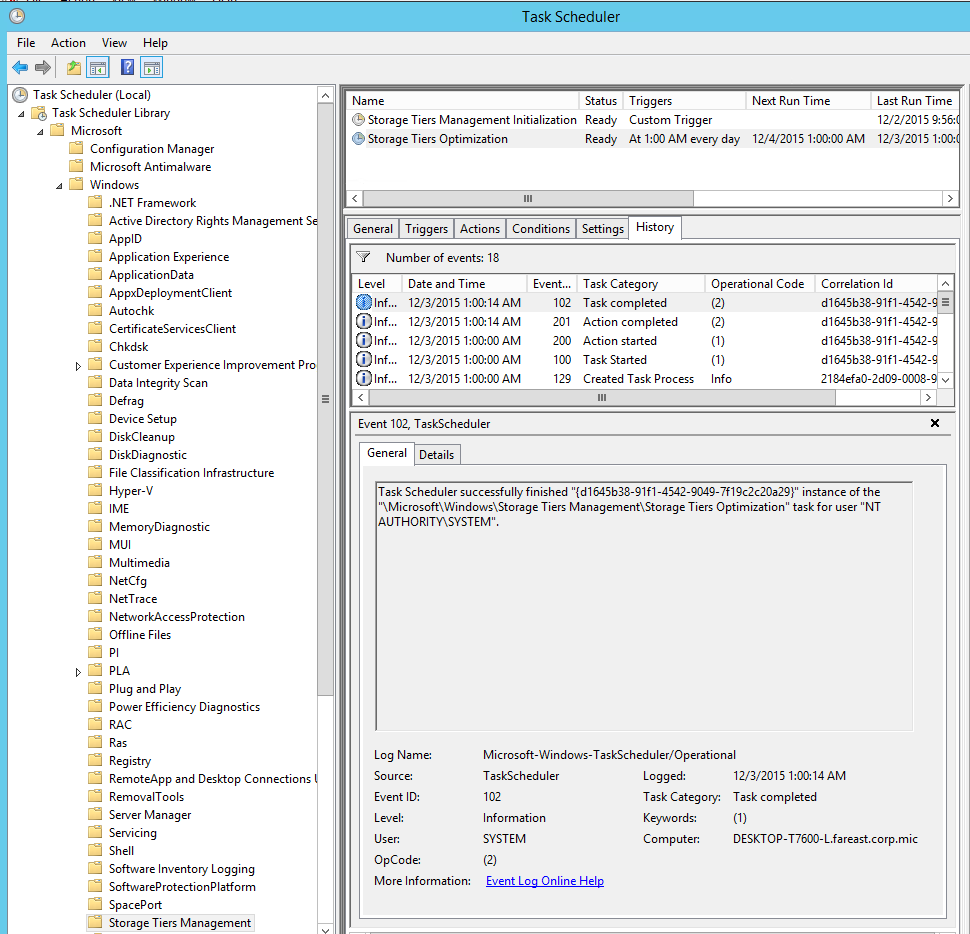
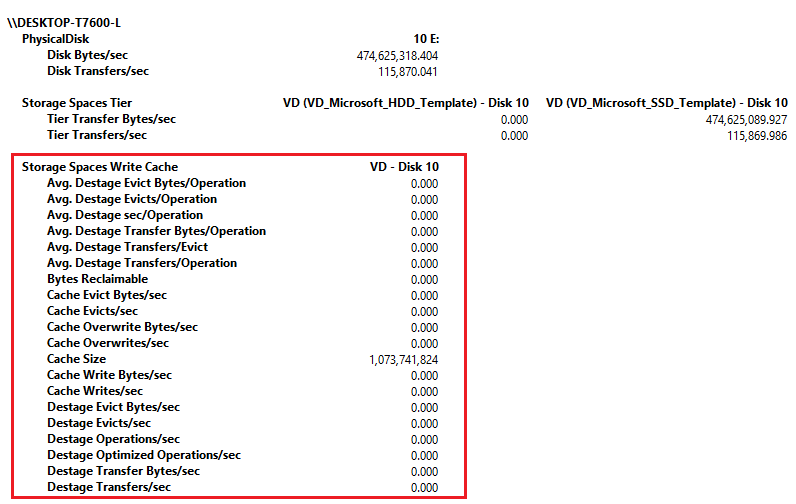
We could the performance had been recovered. The average IOPS is around 115,870. If we excluded the abnormal stage of the first 30 seconds, the average IOPS would be 120,000, which is close to the first test case.
From the picture below, we could prove that all the IO are in SSD tier.
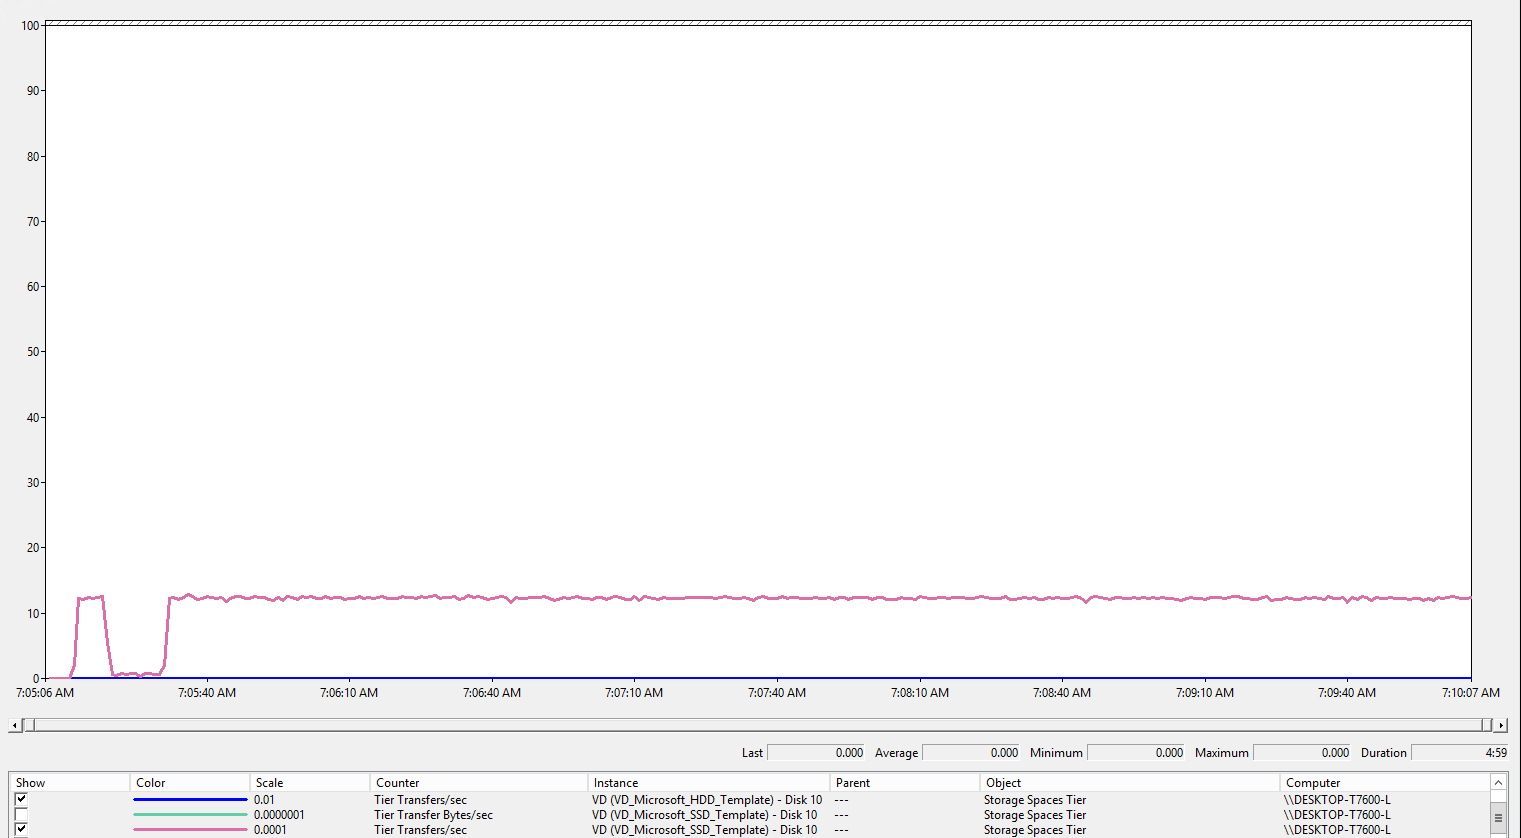
Same as the first test, in this case, we don't need write back cache.
Summary
Now I believe we could answer the questions in the first section with confidence.