SCOM 1801 dashboards (previously 1711)

Here dashboard dashboard <dong>
Come out, come out wherever you are!
Looking at SCOM dashboards in the new Technical Preview had me wondering.
I was totally excited after Ignite for System Center v.Next...
Start at 16:34 in video - BRK1023 https://myignite.microsoft.com/videos/54778
Found the documents before I found the actual widgets
HTML5 overview /en-us/system-center/scom/manage-overview-html5-webconsole?view=sc-om-1801
What's new in 1801 /en-us/system-center/scom/what-is-new-1801?view=sc-om-1801
Release Notes /en-us/system-center/scom/release-notes-1801?view=sc-om-1801
What's new in 1711 /en-us/system-center/scom/what-is-new-1711?view=sc-om-1711
Release notes /en-us/system-center/scom/release-notes-tp1711?view=sc-om-1711
We have lots of widgets to choose from
Unfortunately, the SQL MP visualizations are not yet HTML5 :-(
Web Console, well, okay, I can play
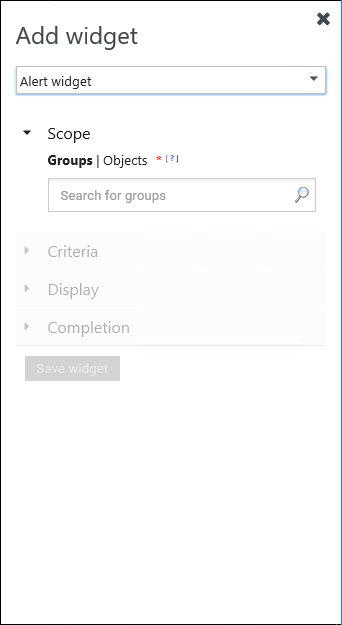
Alert Widget
Scope - Setup for a group or class (my example is All Windows Computers group, could be SQL Servers, SharePoint Servers, etc.)
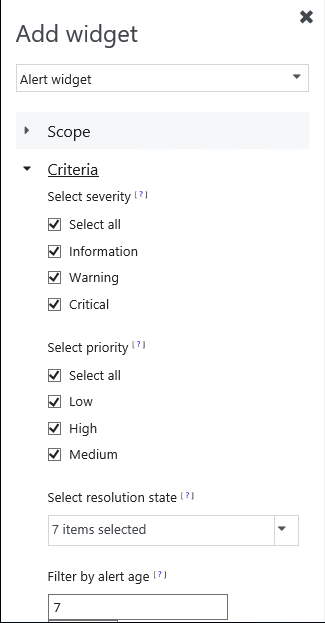
Criteria - Selected Severity = Warning or Critical, changed Alert age to 1 day (default was 7)
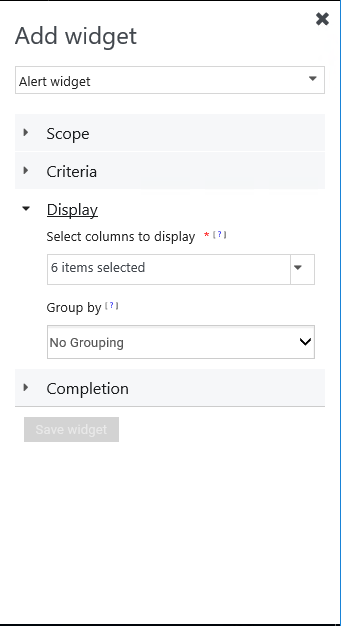
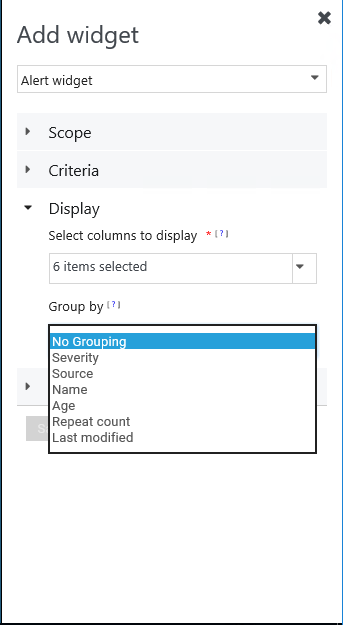
Display - No changes made
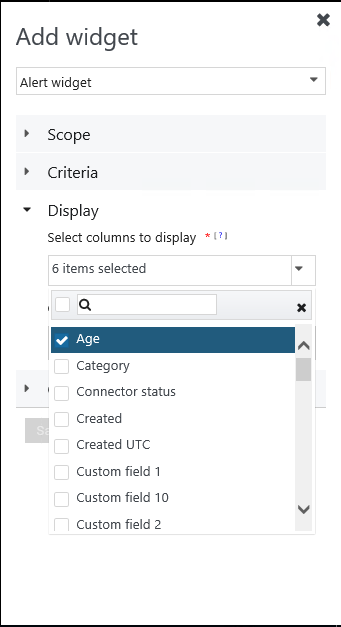
Select Columns to display - looks like all the console options when you click on 'Personalize view'
Group by - Last modified was selected
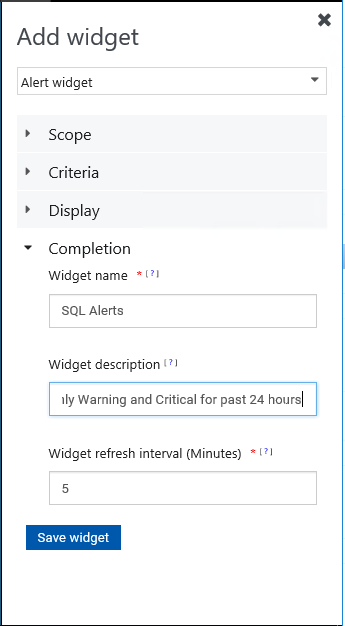
Completion -Click on Save Widget
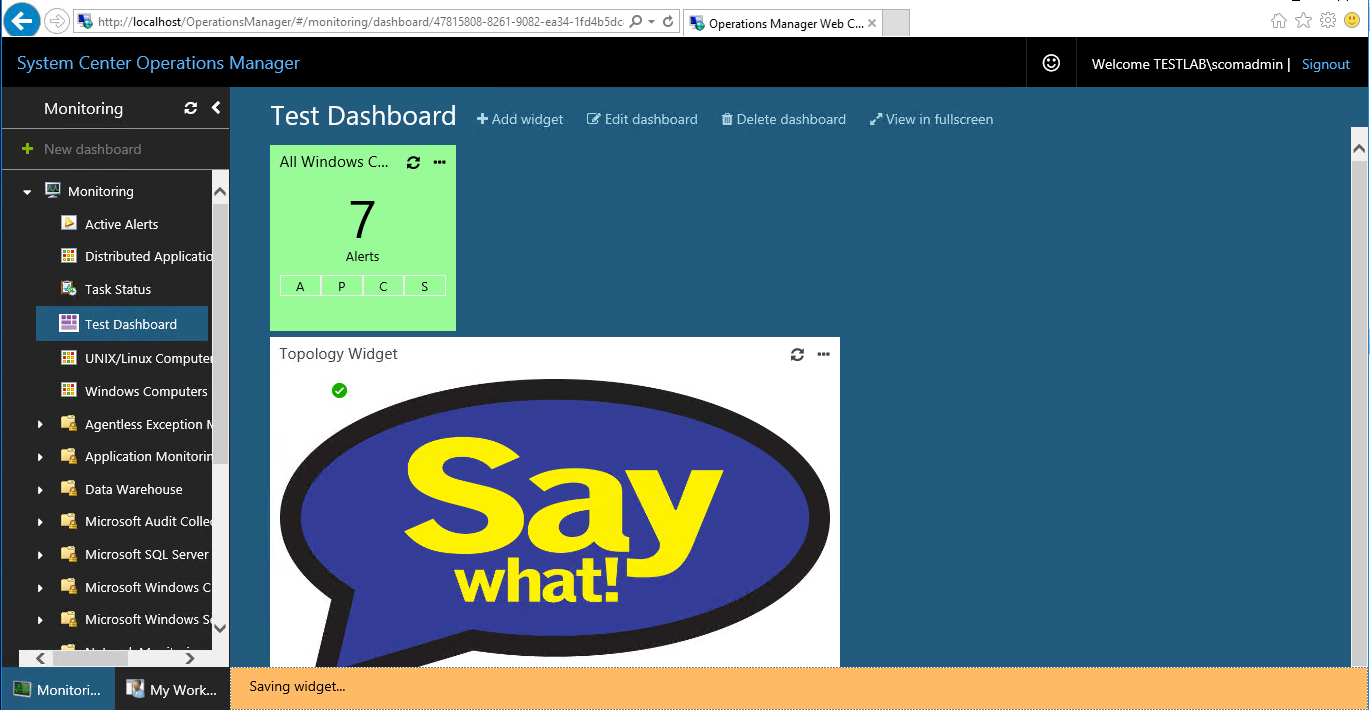
Saving widget
Alert Widget 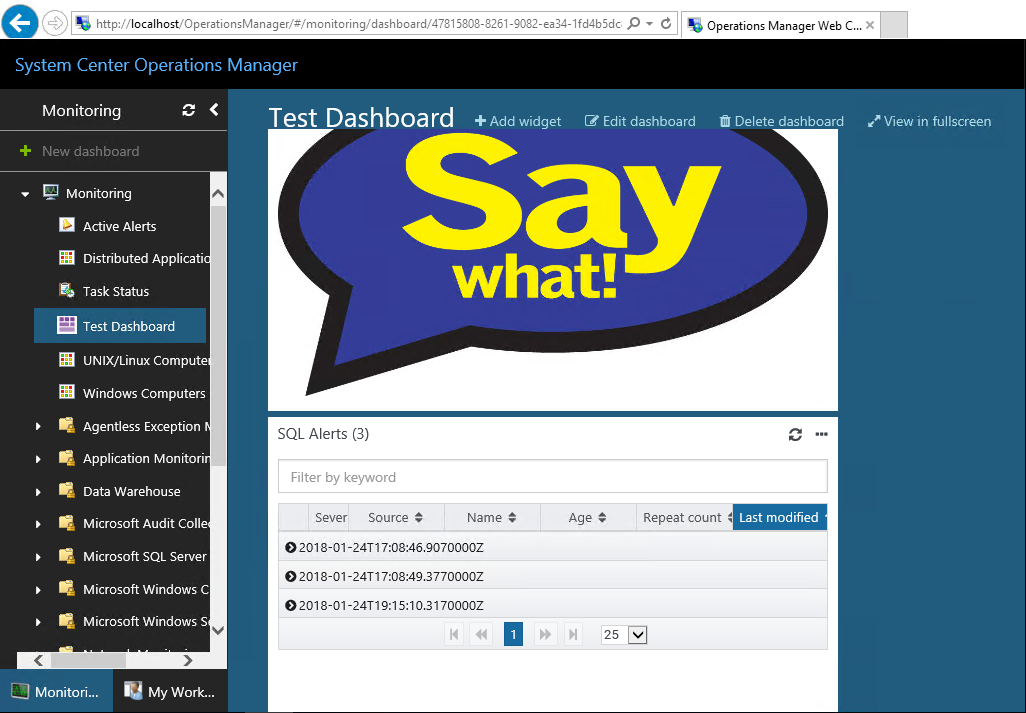
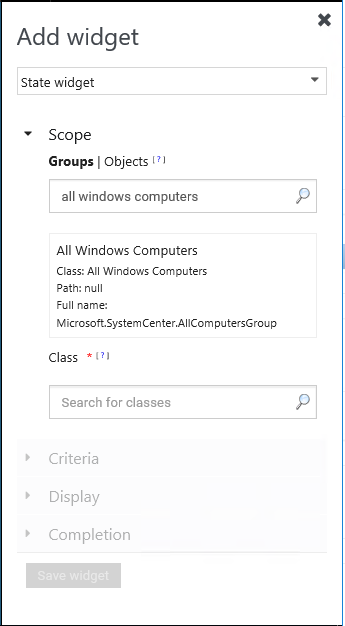
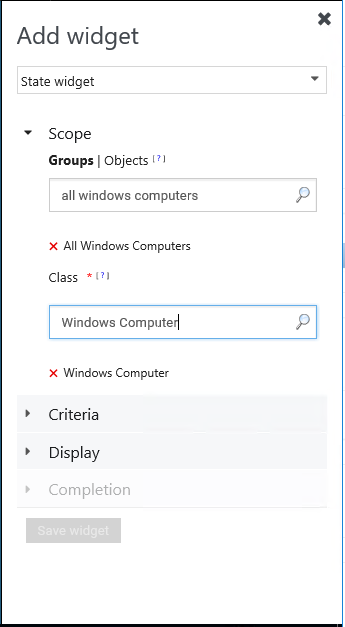
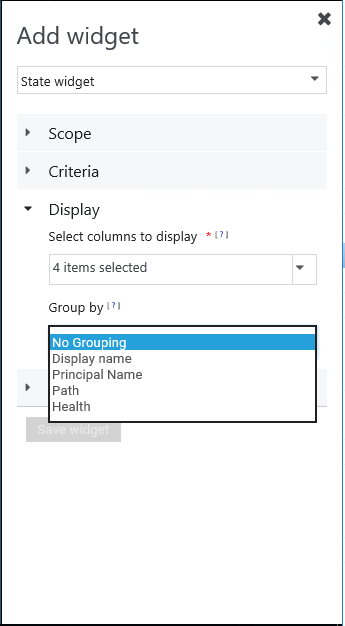
State Widget
Scope - Setup for a group AND class (my example is All Windows Computers group, could be SQL Servers, SharePoint Servers, etc.)
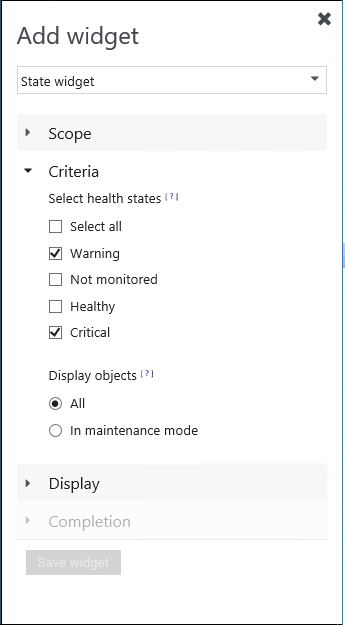
Criteria - Selected Severity = Warning or Critical
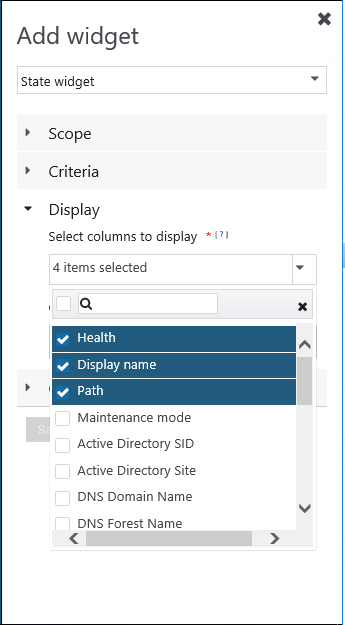
Display -
Selected 4 columns (Health, Display Name, Path, Principal Name )
Group by - Health
Completion - Named widget and added Description
Click on Save Widget

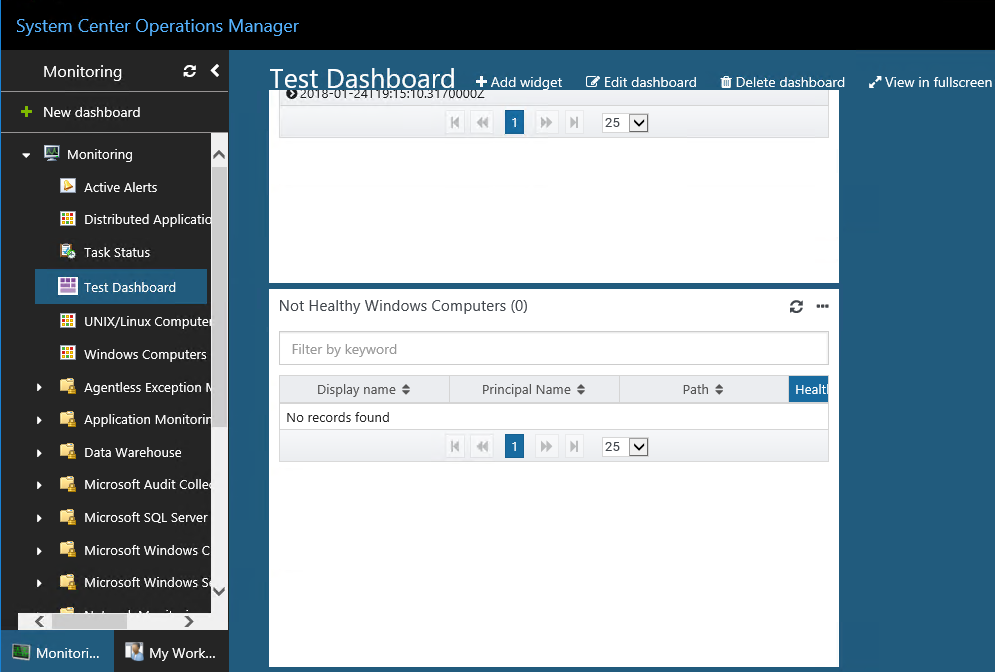
Saved State Widget (NOTE no unhealthy windows computers)
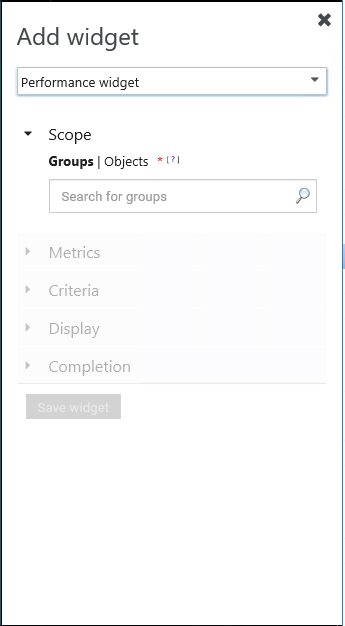
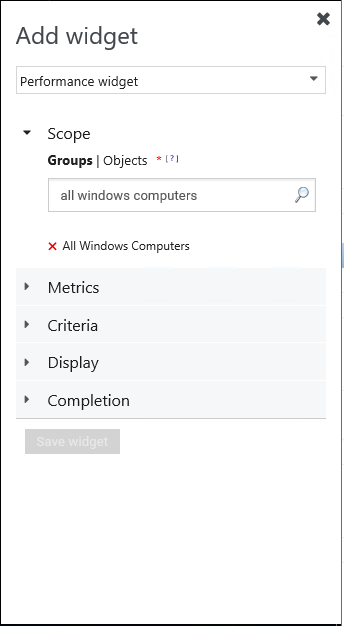
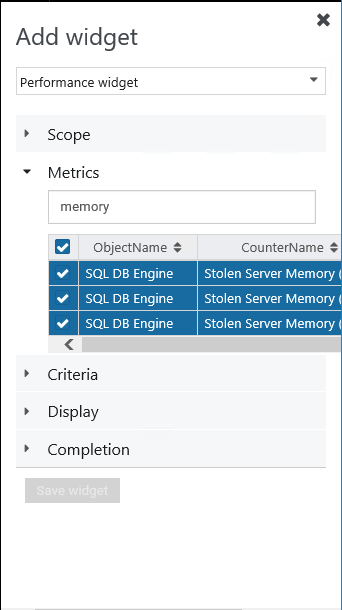
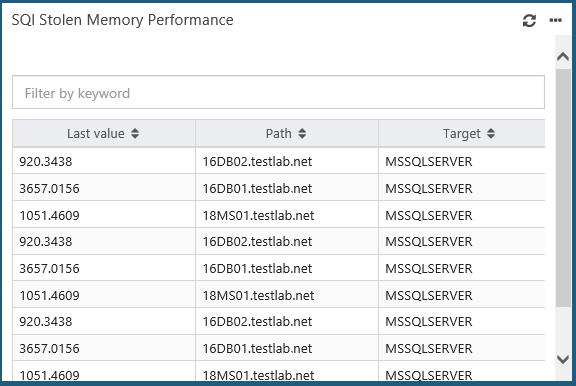
Performance Widget
Scope - Setup for a group AND class (my example is SQL Server Computers, could be All Windows Computers, or SharePoint Servers, etc.)
Metrics - Use filter by keyword
Search string = Memory
Selected = Stolen Server Memory
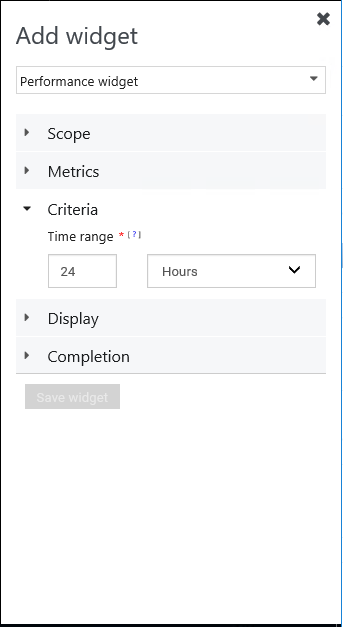
Criteria - Time Range default is 24 hours
Recommend dropping time to 1-4 hours to display less data
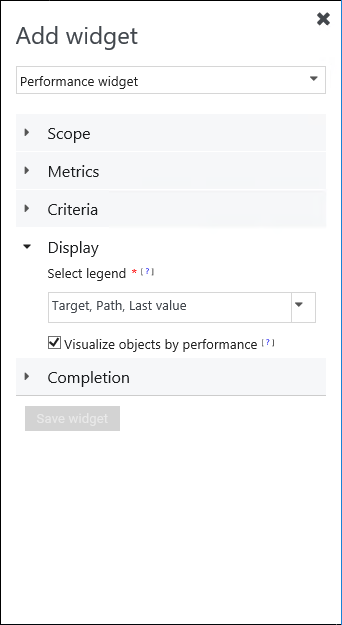
Display -
Left Default
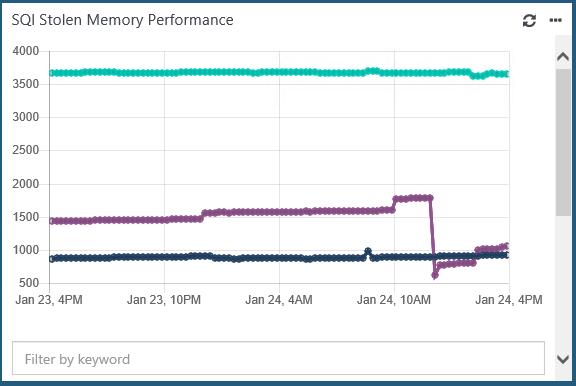
See difference, checkbox is counter intuitive (uncheck gives visual graph)
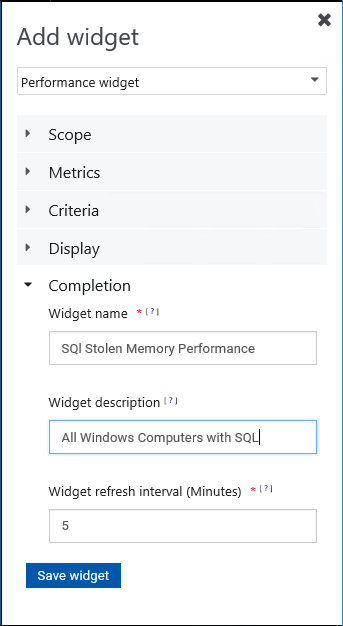
Completion - Named widget and added Description
Click on Save Widget
Performance Widget (visualizations check box checked, NOTE NO visual)
Performance Widget (visualizations check box UN-checked)
Tile Widget
Simple, can setup for a group or class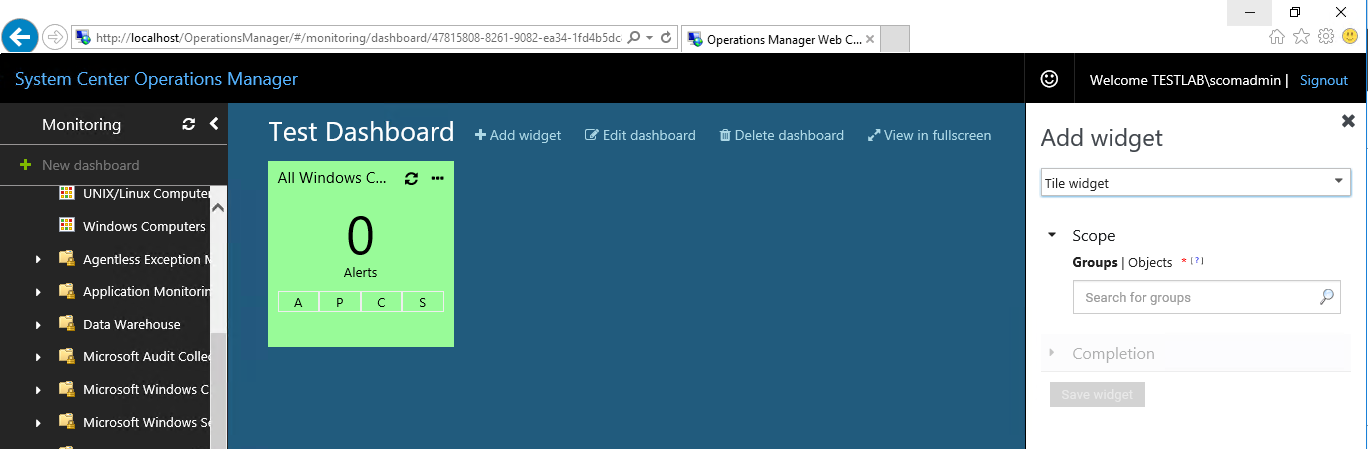
Click on Save Widget
Topology Widget
Gotta have a little fun, right!?
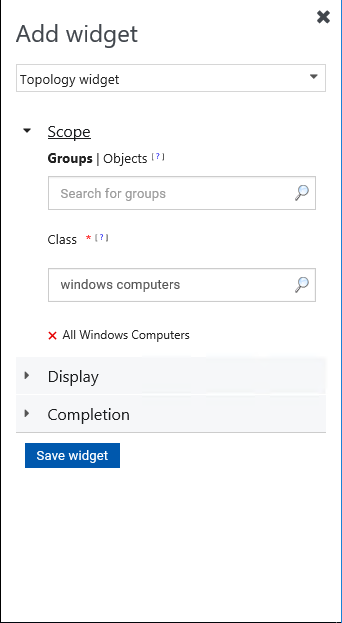
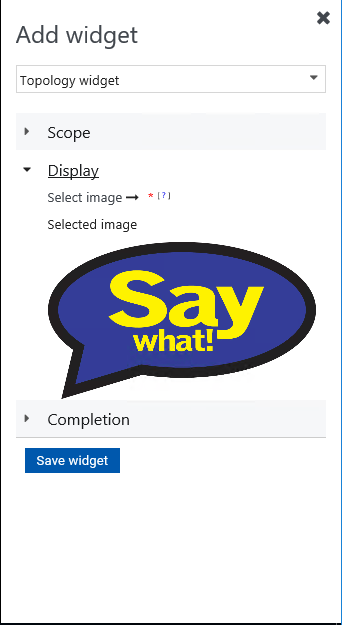
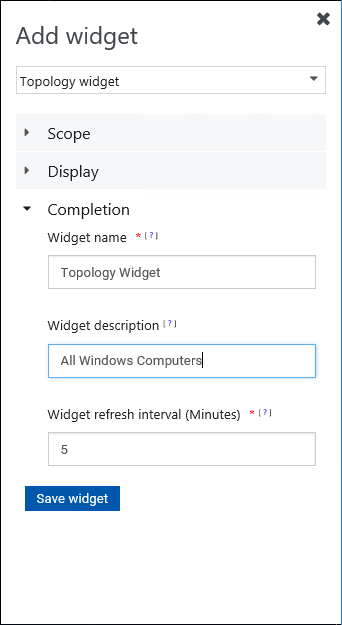
Click on Save Widget
Tile and Topology Dashboards
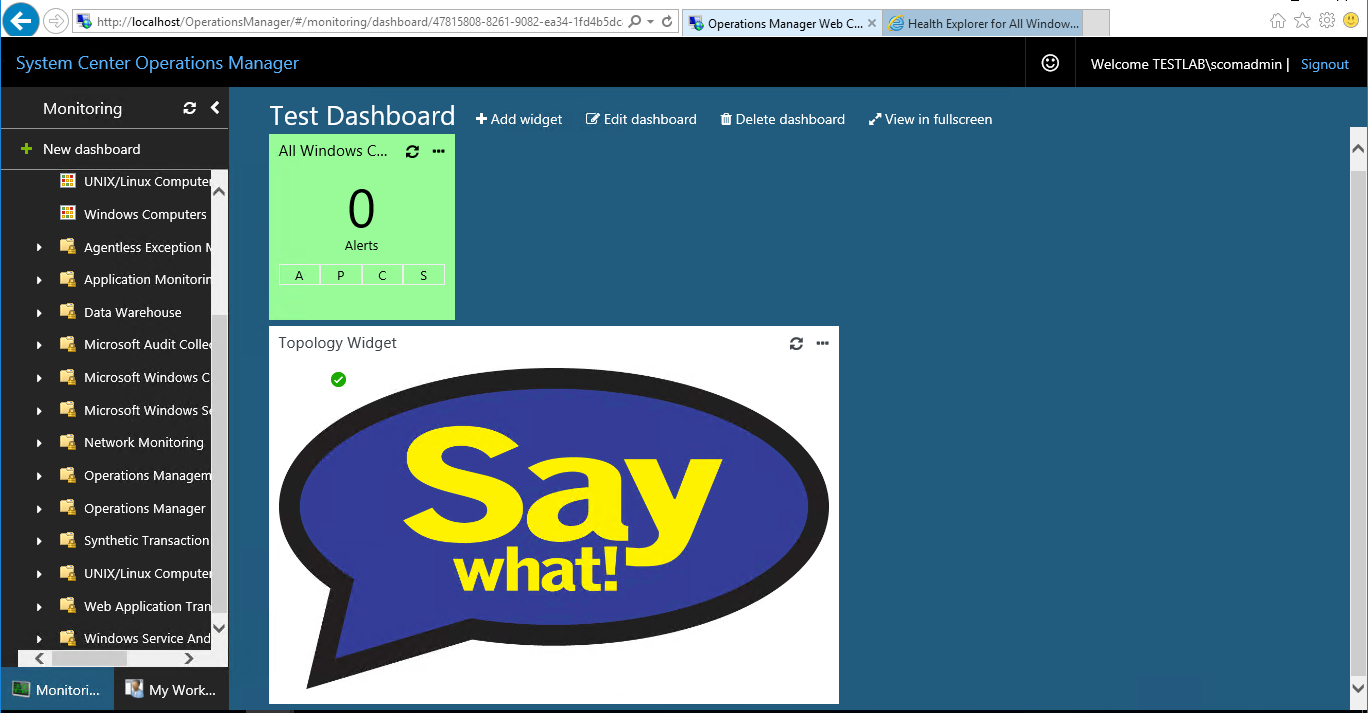
Now let's continue this further next week!