Taming the New Task Manager - 31 Days of Favorite Features in #WinServ 2012 ( Part 14 of 31 )
This article is Part 14 in a series of articles on the "Top 31 Favorite Features in Windows Server 2012" with my fellow IT Pro Technical Evangelists. Be sure to follow them on Twitter and check out their blogs this month for the other parts of this series:
- Kevin Remde - Read Kevin's Full of I.T. blog
- Brian Lewis - Read Brian's My Thoughts on IT blog
- Matt Hester - Read Matt Hester's WebLog
How is Task Manager different in Windows Server 2012?
Server, Application and Process Monitoring at your Fingertips!
In Windows Server 2012, the product team has taken the most frequently used features of the former Task Manager, Resource Monitor and Performance Monitor tools, and they've merged them together to make them more easily accessible on busy servers. As a result, the Task Manager tool in Windows Server 2012 ( and Windows 8 ) has been completely redesigned to roll-up key statistics on ...
- Overall server utilization
- Key hardware subsystems - CPU, Memory, Disk and Network
- Processes - running in either the foreground or background
When you need to analyze current server performance, Task Manager is a great place to start! Task Manager also provides an easy way to jump into the Resource Monitor tool ( yes, the full Resource Monitor and Performance Monitor tools are still there when you need them! ) when more detailed monitoring is necessary on a per-process basis.
In this article, we'll step through the new features in Task Manager in Windows Server 2012 together.
How do I launch the new Task Manager?
You can easily jump into Task Manager from a local or remote console connection in a variety of ways, some of which are common to prior versions of Windows Server:
- Press Ctrl-Shift-Esc key sequence - this is my favorite method, because it allows us to quickly jump into Task Manager to take a peek at the system from anywhere on the server console.
- Right-click on the Taskbar and select Task Manager
- Press Ctrl-Alt-Del and select Task Manager
- Press the Windows key and click the Task Manager tile on the Start Screen
- Press the Windows key and start typing "Tas ..." then click the "Task Manager" tile that appears
- Press the Windows + R keys to open the Run dialog box and run "taskmgr.exe"
How can I easily locate the process I'm looking for?
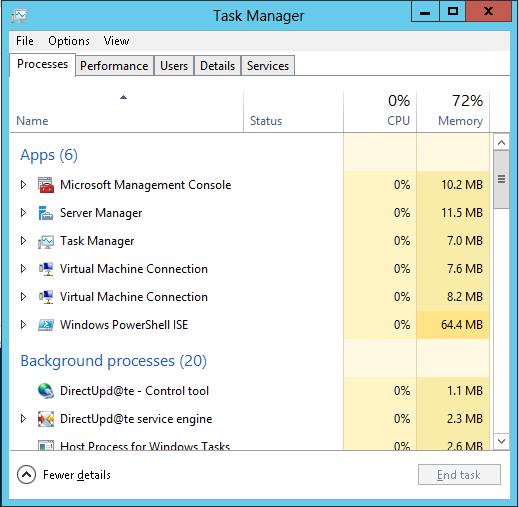
When Task Manager launches, it initially displays a list of foreground applications and background processes with CPU and Memory utilization displayed. I really like the new organizational structure, with applications separated from background processes, because it makes it easier to focus on one or the other depending on the type of scenario you're monitoring. No more sifting through a long list of processes to find what you're looking for on a busy server!
In addition, for each application displayed in Task Manager, the name of the application is displayed first, with a list of open application windows expandable below each application name - great for MDI applications (like MMC consoles, Microsoft Office, etc) that open multiple windows. This approach reduces the number of initial entries in Task Manager by rolling them up into a shorter, easier-to-manage application list.
All columns are also sortable just by clicking on the column heading.
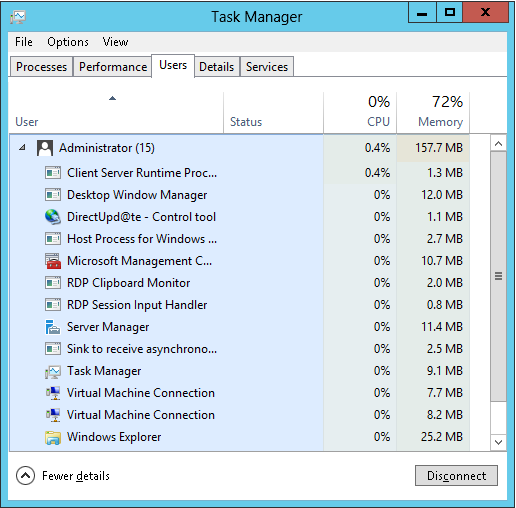
If you're running Remote Desktop Services ( RDS ) on any of your servers, you'll love the Users tab view! It organizes all active applications and processes by interactive user so that you can quickly find the RDS sessions and applications that you'd like to monitor. By right-clicking on a user in this view, you can also "Disconnect" them if needed or "Manage User Accounts" associated with RDS sessions.
How can I see more information about these processes?
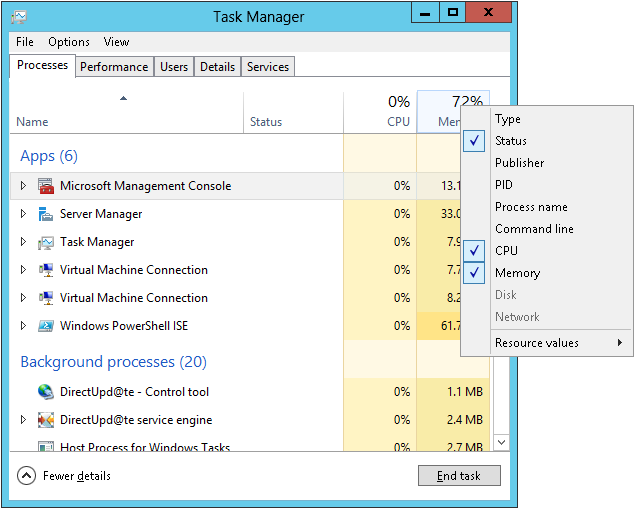
In Task Manager, when you right-click on the heading of the CPU or Memory columns in the Processes view, you'll be presented with a list of additional resource values that can be added to the Processes view. I like to add "Process Name" into my Processes view, so that I have both the application name and process executable name visible side-by-side.
Note, that on Windows Server 2012, Disk and Network resource values cannot be added into the Processes view - they've been disabled because of the overhead they could cause on a busy server every time Task Manager is launched. Instead, if you need to monitor Disk and Network load on a per-process basis, use the separate Resource Monitor tool. In contrast, Disk and Network resource values are visible in the Processes view of Task Manager on Windows 8.
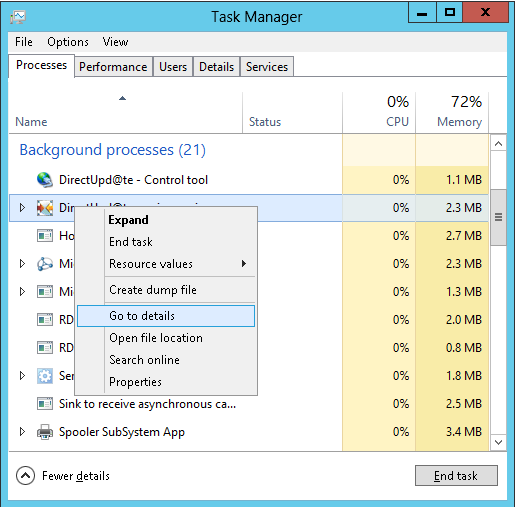
In addition, by right-clicking on any process name, you can select "Go to details" from a pop-up menu to jump directly to ...
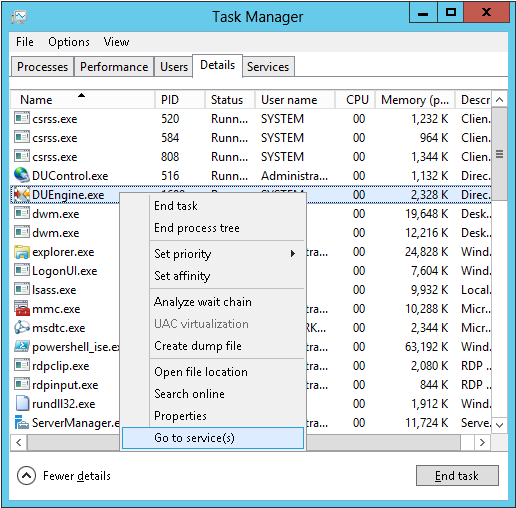
... the Details tab view with the currently selected process highlighted. On this tab, you can get more detailed statistics on each process and also perform some advanced functions like ending process trees, setting process priority, setting processor affinity and viewing the properties of the main executable file for a process. By right-clicking on any process that is running as a background service, you can also select "Go to service(s) " to jump directly to ...
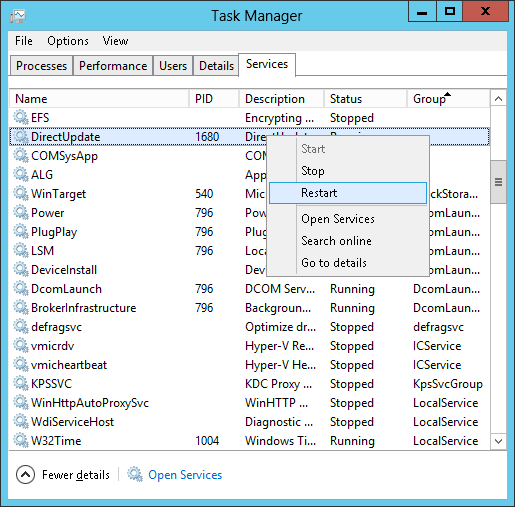
... the Services tab view with the currently selected process highlighted in the list of services. From this tab, you can "Stop" services, "Restart" services, or select "Open Services" to launch the Services administration tool to configure startup parameters for a service.
Awesome! But ... How do I see overall utilization of my server?
Overall server utilization is where the Performance tab comes in! Click on the "Performance" tab and you'll be presented with a wealth of information on each overall server subsystem.
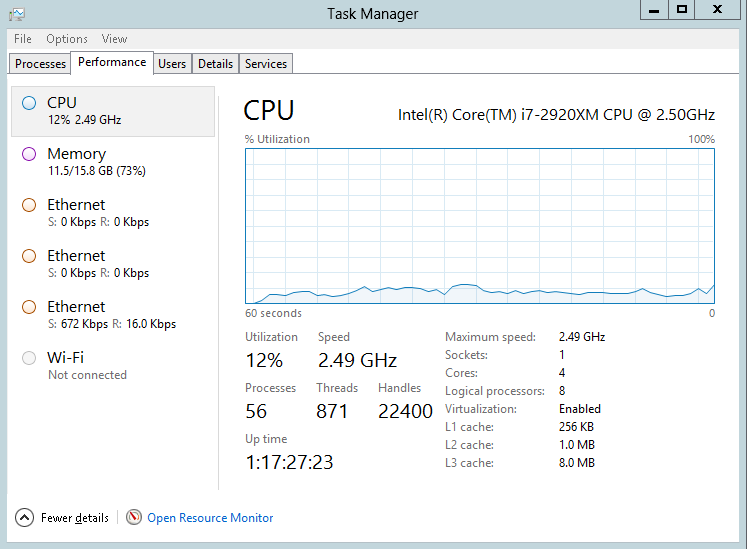
For CPU Utilization, the Performance tab includes some really useful information, including:
- Overall system up time
- Overall utilization of all processors
- Maximum speed of all processors
- Processor subsystem architecture - such as # of physical processor sockets, # of cores, # of logical processors (ie., for hyper-threaded cores), size of L1, L2, L3 caches, and whether hardware virtualization extensions are enabled.
I've found the processor subsystem architecture information really useful when I'm visiting someone else's server for the first time. In an instant, it gives me a picture of the underlying hardware for background information to consider when consolidating workloads on a server. In particular, # of logical processors vs cores is often good information to keep in mind - afterall, hyperthreaded cores are not really "true" cores and shouldn't be treated as such for capacity planning purposes. Hyperthreaded cores usually provide only an additional 12-15% performance benefit on most systems, so I'll usually base my capacity calculations for CPU on the # of true cores and then consider the extra 12-15% that hyperthreading can provide as a "buffer zone" for CPU capacity.
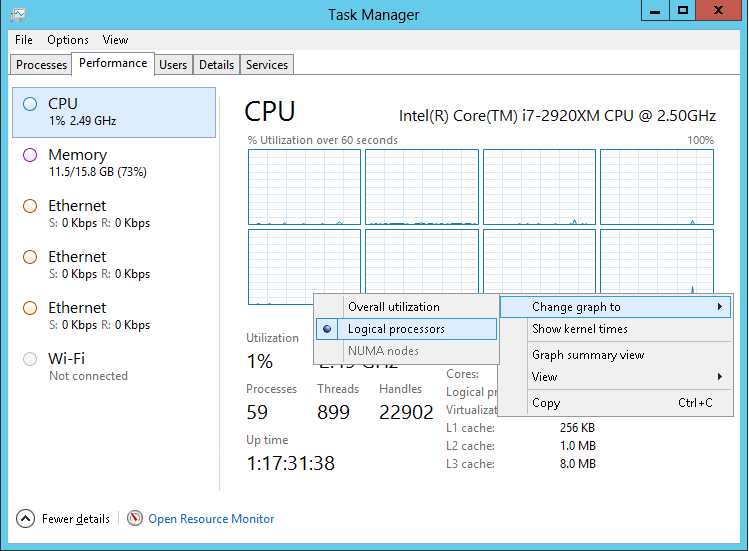
By right-clicking on the CPU graph and selecting "Change graph to -> Logical Processors", you can see a processor utilization breakdown across logical processors to confirm that load is being properly balanced across processors.
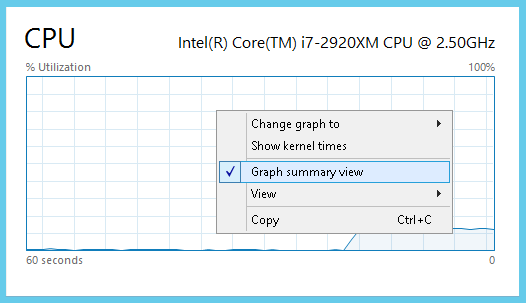
In addition, on any of the graphs on the Performance tab, you can right-click and select "Graph Summary View" to see just the graph without all of the other numeric counters - very useful when stress testing or monitoring a particular server subsystem.
Hey! Where's My Disk?!
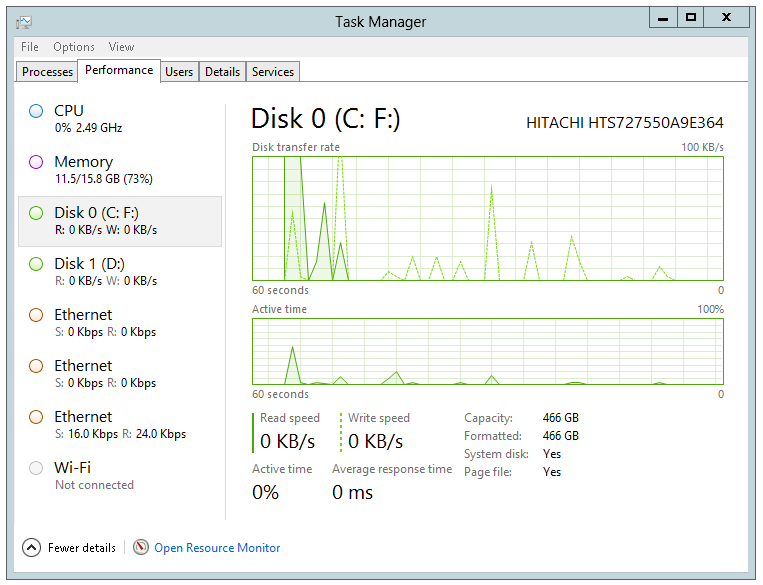
In the screenshots of the Performance tab above, you'll note that Disk performance is not being listed as a page to display ... by default, Disk performance monitoring is disabled in this view due to possible overhead on busy servers. However, unlike the Processes tab, you can enable Disk performance monitoring on this tab by running the following command from a Command Prompt launched using the "Run as Administrator" option.
diskperf -y
After running the diskperf command above, close and re-launch Task Manager to view Disk performance statistics on this tab, as shown below ...
Thanks ... for the Memory (Statistics)!
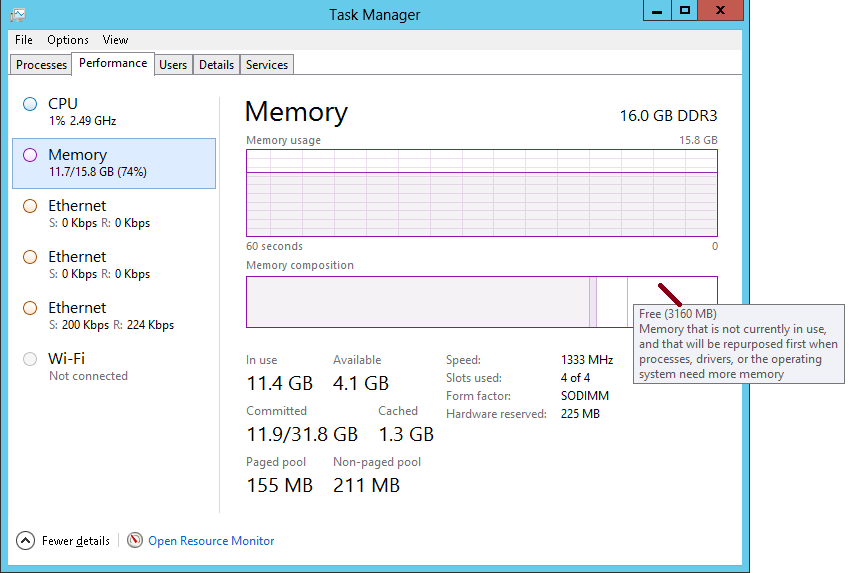
The Memory page on the Performance tab really has some useful information, too! In addition to overall memory consumption, it shows a summary of the physical memory subsystem, including memory form factor, memory speed and # of memory slots available - really useful when trying to determine how best to upgrade memory for a server. In addition, a Memory Composition graph is provided to show the following breakdown of memory utilization at-a-glance:
- In Use - Memory used by processes, drivers or the operating system
- Modified - Memory whose contents must be written to disk before it can be used for another purpose
- Standby - Memory that contains cached data and code that is not actively in use. This memory could be reallocated to other processes, drivers or the operating system if Free memory is not available.
- Free - Memory that is currently not in use, and that will be repurposed first when processes, drivers or the operating system need more memory
You can hover your mouse over each area displayed in the Memory Composition graph for a description of each memory category.
Let's Grab Some Net!
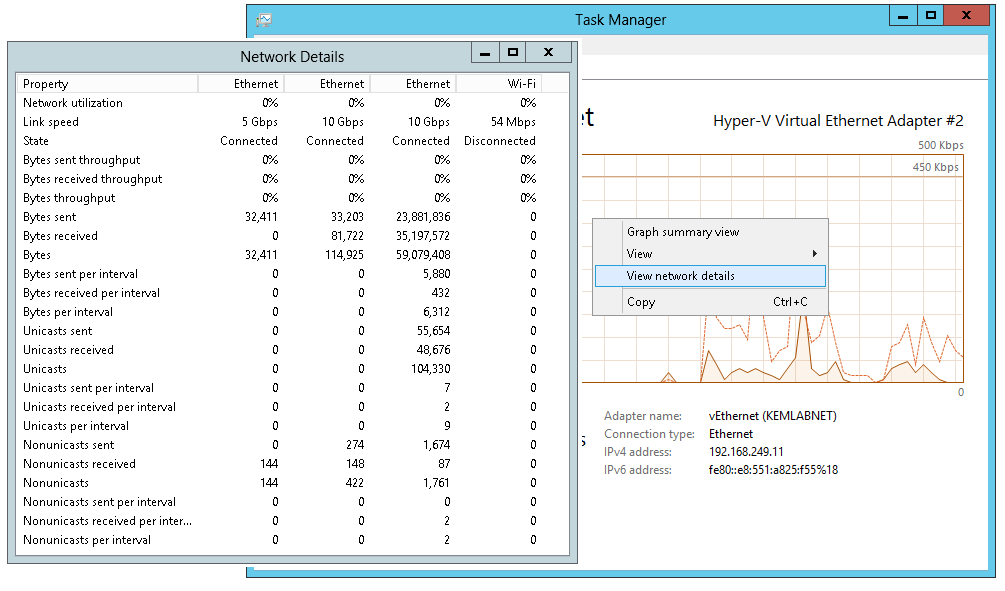
The Performance tab displays a ton of network performance information with separate information pages for each physical NIC, virtual NIC and Teamed NIC. In addition, by right-clicking on any network graph, you can also select "View Network Details" to get a much more detailed real-time breakdown of network traffic.
Other Task Manager "Tricks" ...
Here's some other Task Manager "Tricks" that you may find helpful when monitoring server performance:
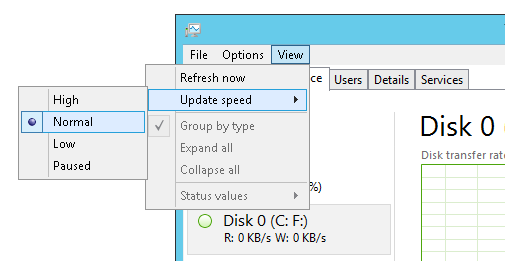
- Alter the timeframe ... By default, the results shown on the Performance tab are monitored once each second and displayed across the last 60 seconds. If you'd like to either collect performance results more frequently or have a longer period of time displayed, you can change this setting in the View menu by selecting "Update Speed". "Normal" is the default setting, which monitors the last 60 seconds, "Low" monitors the last 4 minutes and "High" monitors across a 30-second time period. I use the "Low" setting often, as I frequently need to monitor more than just the last 60 seconds when I'm evaluating server performance. In addition, the "Low" setting also helps to reduce the load placed on a server when monitoring its performance. If you need to monitor for different durations than these three options, you can launch the separate "Performance Monitor" application for more granular or longer timeframes.
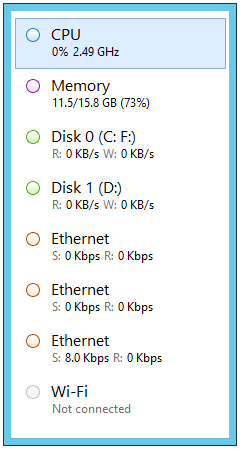
- Summary View - Right-click on the name of any page ( ie., "CPU", "Memory", etc ) on the Performance tab and select "Summary View" for a compact performance view that hovers above all active applications. Double-click on any page name in the summary view to restore back to the full view. This compact view is very helpful when testing server performance with one or more foreground applications because it lets us keep a "birds-eye" view on performance statistics while running other applications.
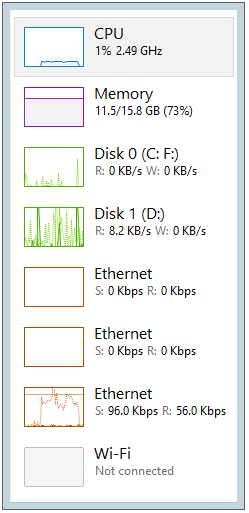
- Show Graphs in Summary View - For even more performance detail in a compact format ... When Summary View is active as described above, right-click on the window and select "Show Graphs". A performance histogram graph will be displayed next to each category in the same window that hovers over all other active applications!
This is Cool! How do I get the new Task Manager?
This article described the Task Manager improvements in Windows Server 2012 to provide fingertip access to key server, application and process performance statistics. To explore the new Task Manager for yourself ...
- Download the Windows Server 2012 installation bits!
- Build your own Windows Server 2012 server lab environment!
- Join our FREE Windows Server 2012 "Early Experts" Challenge to continue your learning and prepare for MCSA certification!
How are you using the new Task Manager?
What new features do you like best? Do you have an interesting use case about how you're planning to leverage the new Task Manager in your environment? Feel free to share your story in the comments below!
Hope this help,
Keith
