Troubleshooting Basics for the Netlogon Parser (v1.0.1) for Message Analyzer
Hi all, Brandon Wilson here again to talk to you a bit more in depth about the Netlogon parser for Message Analyzer. Last time, I gave you a basic introduction on the anatomy of the parser, how to open log files, and the basics on navigation with the parser and what can be seen. In case you missed it, pay a visit to the Introduction blog, as it is a pre-requisite to this blog to get a little familiarity with the parser. It would also be a good idea to get a handle on Netlogon Error Codes from the Quick Reference: Troubleshooting Netlogon Error Codes blog, and if you you’re brave, you can add some more on top of that by reviewing the Quick Reference: Troubleshooting, Diagnosing, and Tuning MaxConcurrentApi Issuesblog. Go ahead; I’ll give you a bit to read it…I’ll forewarn you, those 3 links alone are about a hundred pages of reading!
Ok so now that you’ve finished the “light reading” in the Introduction blogand the “Quick References”, I’ll move on so we can have a little bit of fun! One important note I want to make here is that there might be differences in the layout of Message Analyzer vs. what is covered in this blog based on whether you upgraded from a previous version of Message Analyzer or performed a new/fresh installation. The same methods still apply, so no worries there!
In this post, we’re going to cover some topics that expand beyond what was discussed in the introduction blog. As with all my posts, you can refer to the TOC at any time to jump to a specific area.
If you don’t have Message Analyzer v1.1, you’ll need it to utilize the Netlogon parser, so I strongly suggest downloading it here!
Table of Contents
Recap: Opening a Netlogon log file in Message Analyzer v1.1
Do I have all the subnets in my network mapped to sites in Active Directory?
Do I have a MaxConcurrentApi issue?
Are my RPC ephemeral ports exhausted?
Recap: Opening a Netlogon log file in Message Analyzer v1.1
Rather that assume you read the Introduction blog, I figured I might as well give you a step-by-step reminder of how to open the Netlogon log file in Message Analyzer. So without further ado, here you go:
1. Open Message Analyzer
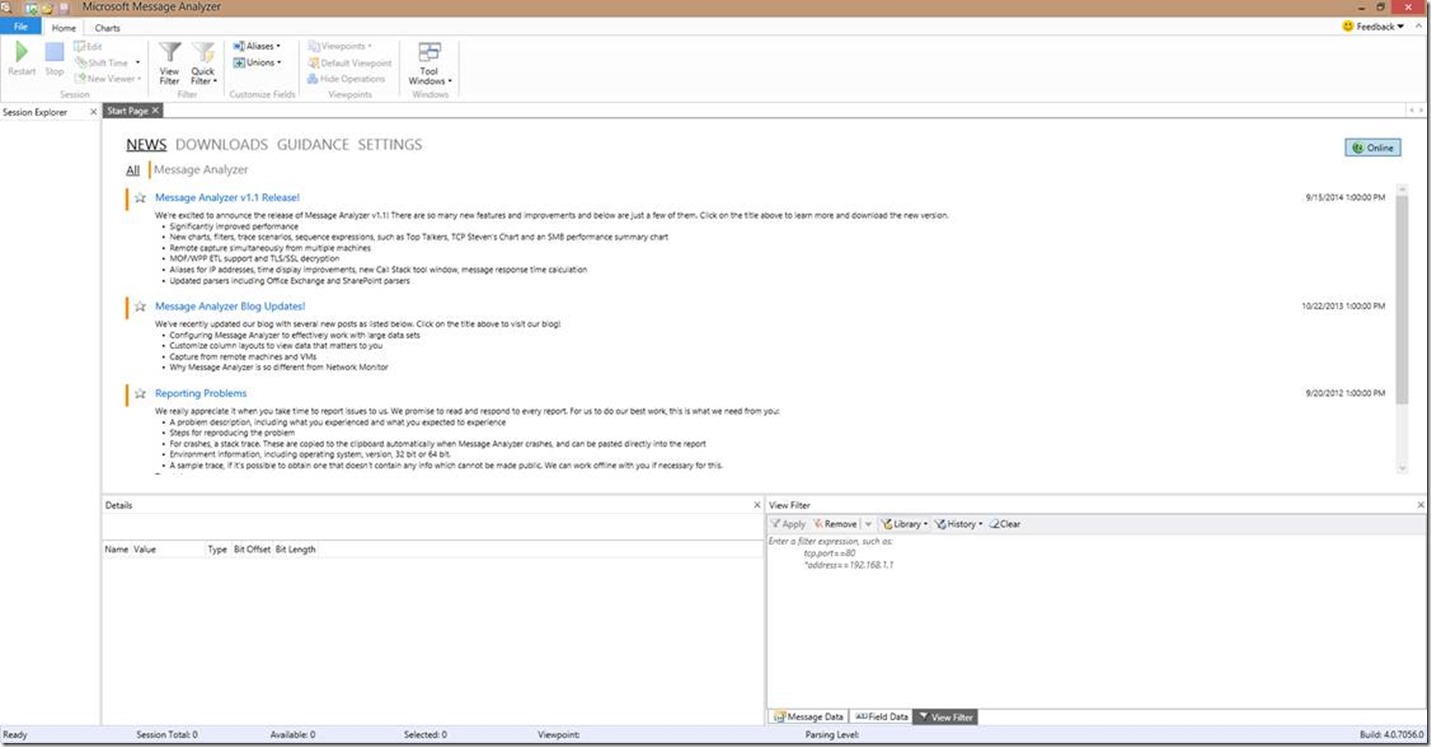
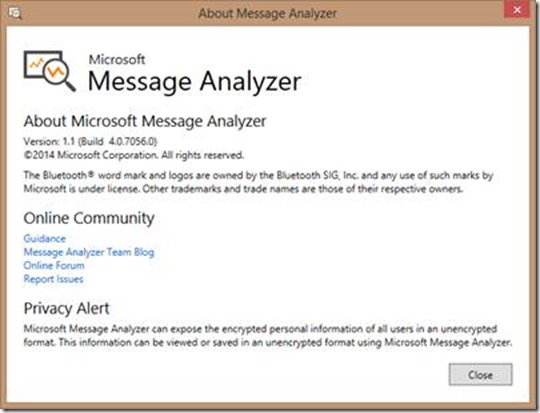
a. Notice the version number at the bottom right corner of the Message Analyzer window. Version 4.0.7056.0 is equal to Message Analyzer v1.1. If you don’t see a version number, you can go to File|About. Depending on whether you upgraded from a previous version of Message Analyzer or performed a new/fresh installation, you may or may not have the version number.
2. There are two primary methods to open a Netlogon log (or other text log). You can drag and drop the file, or you can use the File menu (File|Quick Open).
a. There will be a small delay the first time you open a text log based file due to Message Analyzer analyzing the available parsers on the first run before you can make your selections. Opening additional text log files while Message Analyzer is open should not experience this delay.
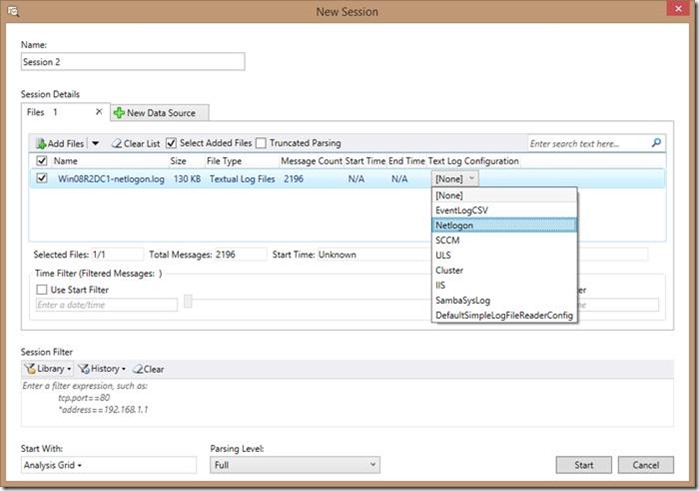
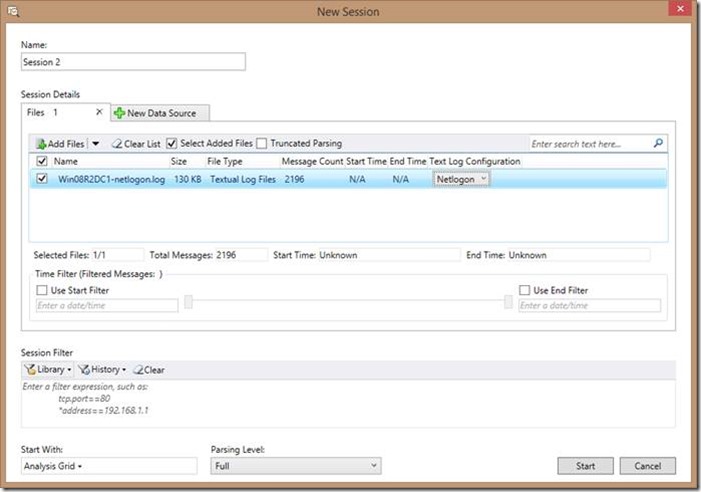
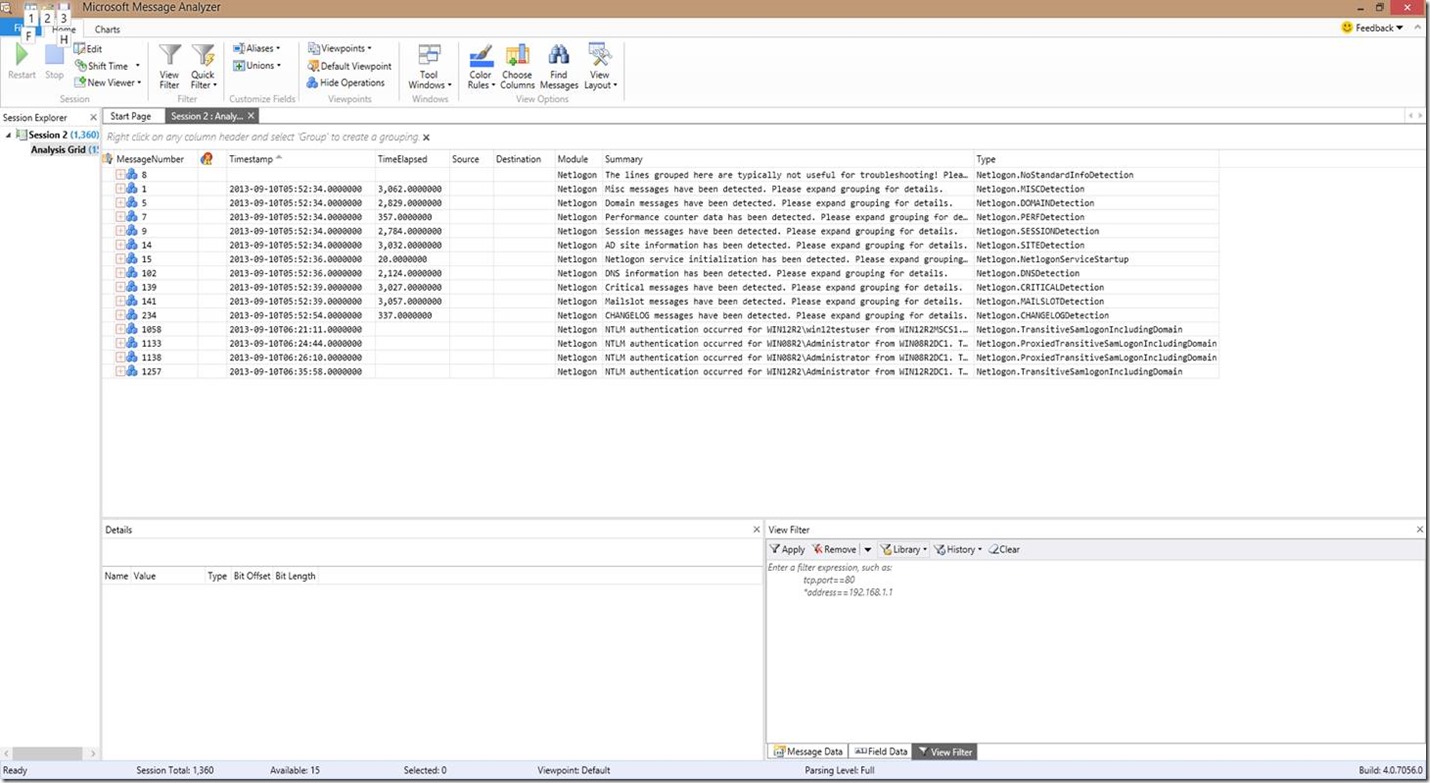
3. Once the parsers available are analyzed, you will be presented with the below window. From this window, select the appropriate text log configuration parser (in this case, Netlogon), then click the Start button.
4. Message Analyzer will now begin parsing the log file. Depending on the log file size, this may take some time. The default log file size of 20MB typically will take between 8-10 minutes, depending on the number and type of messages included in the file.
5. When parsing is complete, the bottom left corner of Message Analyzer will say “Ready”, and the Session Explorer (the pane with all the data) will stop updating, as seen in the screenshot above.
Do I have all the subnets in my network mapped to sites in AD?
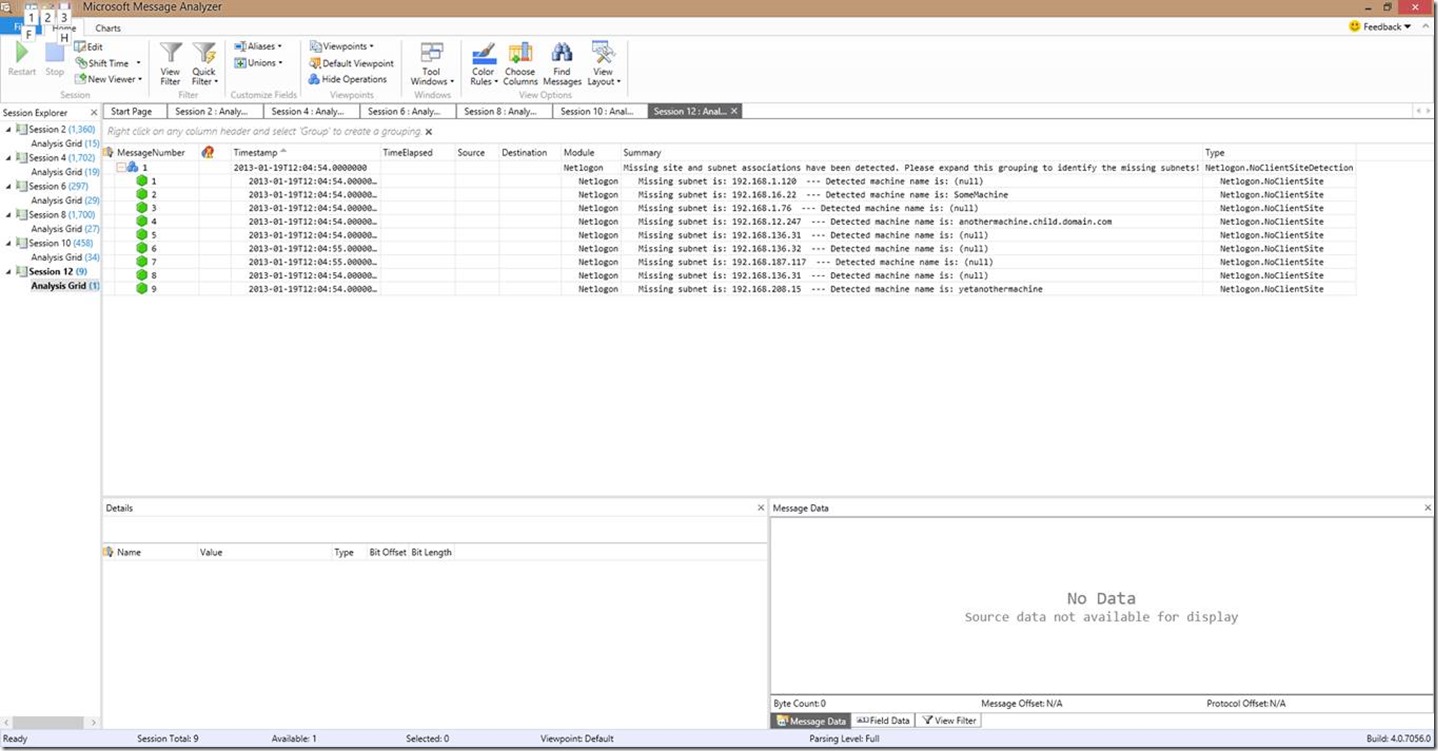
We discussed this in the introduction, so now we’ll dig a bit more into the specifics. Just to recap, if you are reviewing a Netlogon log from a domain controller and you see a grouped entry that says “Missing site and subnet associations have been detected”, then you have subnets that are not associated with sites. Below is a screenshot as an example.
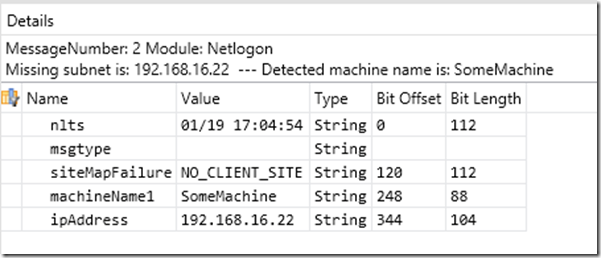
If you select one of the individual frames within the grouping, the details window will also provide you the specifics of the call. You will see fields for the timestamp (nlts), the fact no site is tied to the subnet (siteMapFailure always = NO_CLIENT_SITE), the machine name (machineName1), and finally the IP address (ipAddress). Not that the friendly summary text doesn’t already tell you that information, but if you prefer the table, it is available.
So, what do you do? Well, this becomes a basic identification of tying the connecting machine to the appropriate site. If you have naming conventions that can help you identify the site the machine should belong to, then your task may be made that much simpler (this is not a sure fire way of detection though since some users may roam from site to site on occasion). Most likely, you’re going to need to get with your network team to determine where the subnet is located. From there, you can make the appropriate assignments within Active Directory Sites and Services. Also, this might be a good time to get processes in place at your company so the team responsible for creation of sites and subnets in Active Directory is notified when network changes are made, or new subnets are added. I have seen a lot of domain controllers, member servers, and client machines get hit in the gut simply because of a lack of processes like this. After all, nobody likes to take forever to logon, and nobody likes unexpected failures or slowdowns in their applications!
It should also be noted that it is a good idea to evaluate all of your domain controllers periodically to check for site/subnet associations that aren’t defined; especially if you’ve found in your logs that you have the NO_CLIENT_SITE entries. It should also be noted that these entries will only be seen in the Netlogon logs of domain controllers. You can find a simplified way of tolling your domain controllers in the blog post “Roaming AD Clients, with an Updated Script”.
Do I have a MaxConcurrentApi issue?
As we discussed in the Introduction blog, we’ve made the detection of MaxConcurrentApi as simple as possible in the Netlogon parser. How much easier can it get than a message telling you “A MaxConcurrentApi issue has been detected”! The point of this blog is not to tell you how to troubleshoot those issues, but rather how to interpret what you’re seeing in the parser. If you want to know more on troubleshooting the MCA issues, check in on Quick Reference: Troubleshooting, Diagnosing, and Tuning MaxConcurrentApi Issuesas mentioned above. As a shameless plug, we also have a premier webcast available in the Americas called “Troubleshooting Netlogon for NTLM Auth” that has sessions from time to time (or you can request it for your company if you have a premier contract!).
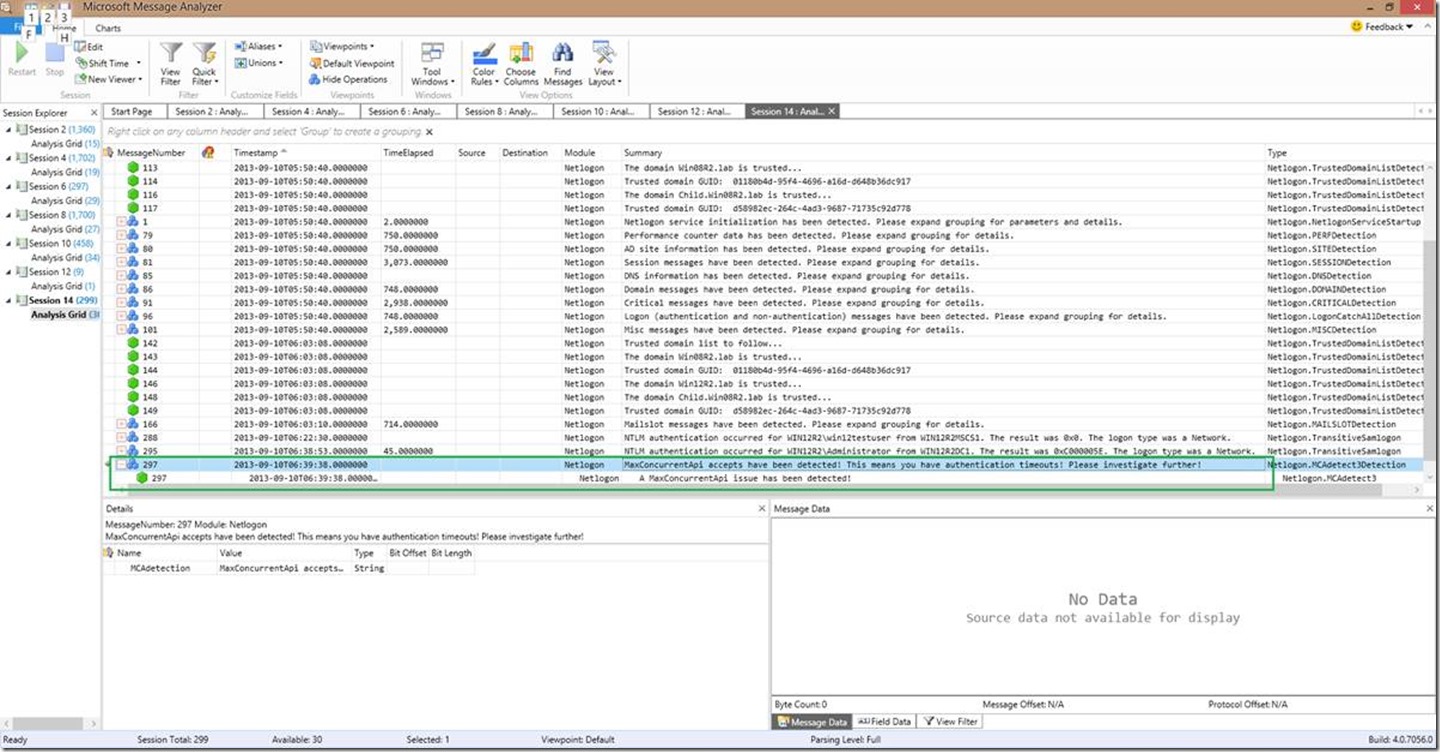
So, when we detect a MCA issue, this is what you can expect to see initially:
Nice right!
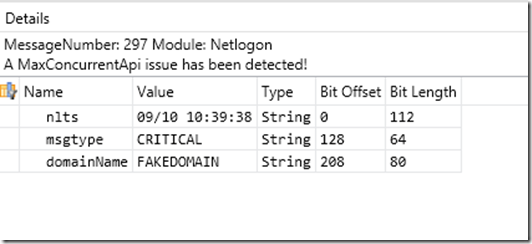
So if you were to expand that grouping and look at the individual line items in there, you can see a little more in the details. Specifically, the message type (msgtype field), which will ALWAYS be CRITICAL. If the domain name is also in the line, you will also see the domain name (domainName field), which is this case is called FAKEDOMAIN.
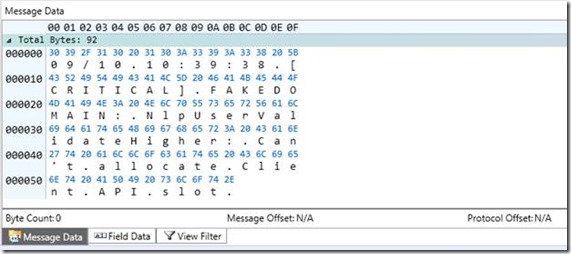
What the parser is actually looking for here is a line with the words “Can’t allocate client API slot”, which will be recorded in the Netlogon log whenever a MaxConcurrentApi issue occurs. You can see this in the Message Data window as seen below.
Are my RPC ephemeral ports exhausted?
Another thing we discussed in the Introduction blogis the simplified method we’ve provided for detecting RPC port exhaustion in Windows. There are other ways to do this of course, such as using netstat -ano (or netstat -anob which gives you a breakdown of what processes are using the ports), but using the Netlogon parser you can now determine quickly if you are having the problem in the first place. It should be noted that this method can be viable even if you aren’t noticing problems you suspect Netlogon has a part in! That being said, if you do have ephemeral port exhaustion, there is still more follow up to do to find out who/what is causing the problem (refer to the netstat commands I just mentioned as a starting point).
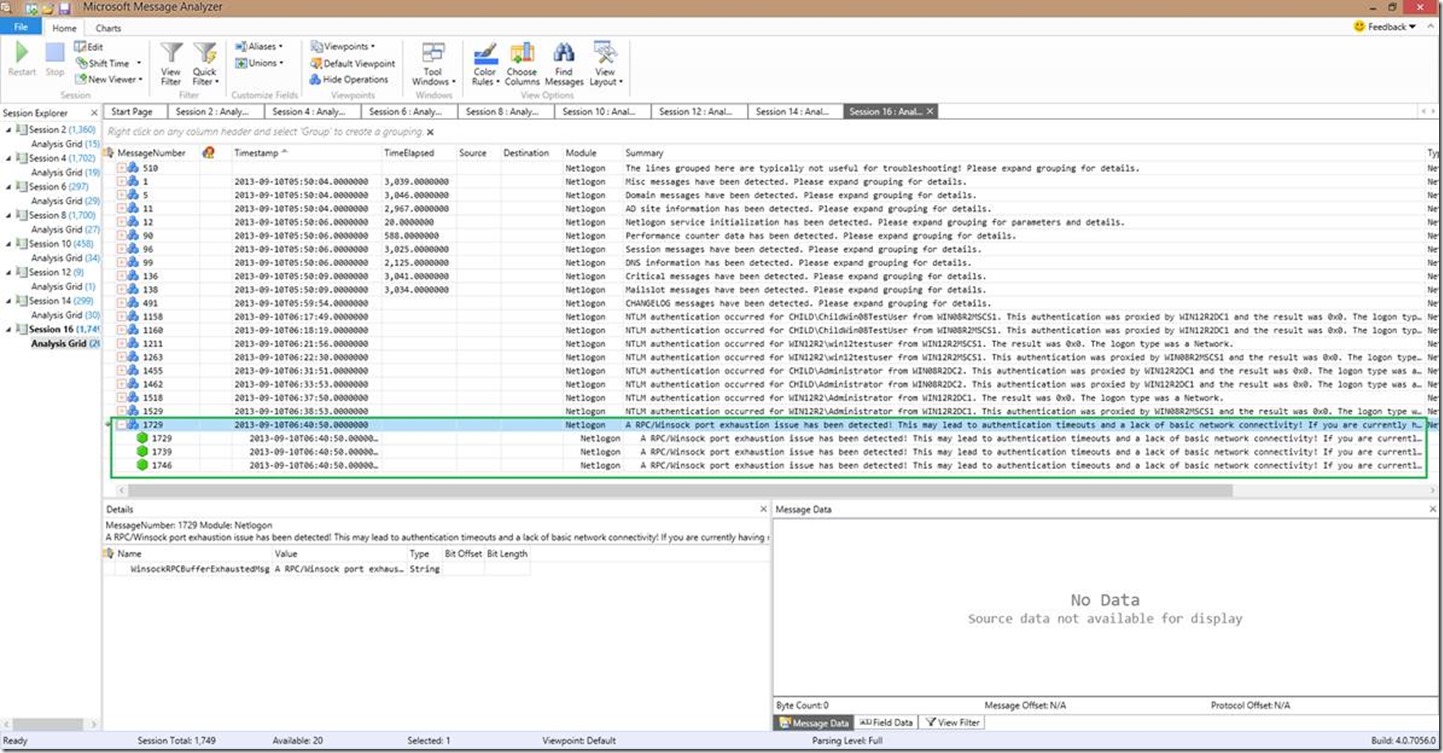
So let’s see what this looks like at a high level…
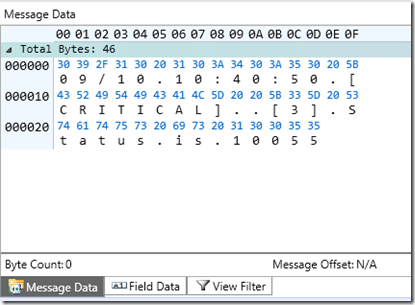
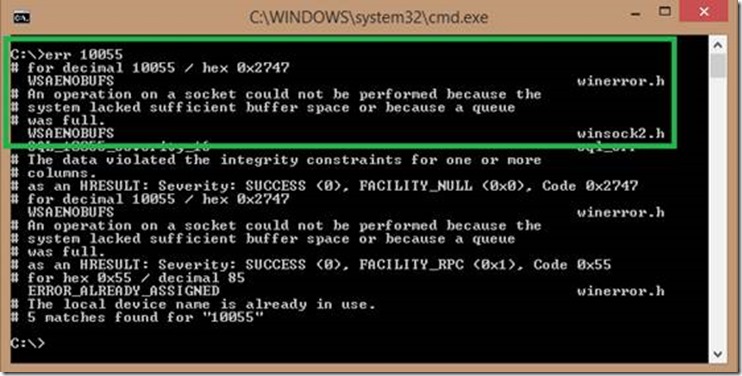
For the winsock buffer exhaustion detection, the Details pane doesn’t give you much that’s useful other than a timestamp (nlts), so I won’t bore you with a screenshot of the details pane. However, the Message Data pane shows you what made the parser flag the problem in the first place, which is a “Status is 10055”.
If you were to translate this error code (with err.exe for example), this is the output you would see:
Hunting for errors 101
In future posts, I’ll dig into the specific call areas to cover specific items to look for. Since we’re covering basic troubleshooting here, what I’m going to cover today is some basics of what might be interesting at a glance, as well as filtering the output of the Netlogon parser. For those of you who have filtered with Network Monitor before, you should find this really easy. For those who haven’t done any filtering in Network Monitor previously, well, this will still probably be fairly easy. If there’s one thing our Message Analyzer development team has worked on, its ease of use!
So I’m going to provide an example here, but be advised that this sample file has been manually created by me to show you the techniques you need to be successful. If you have already read through the “Quick Reference” blogs I wrote, for this portion you will want to at a minimum read through the error code table in the Quick Reference: Troubleshooting Netlogon Error Codesblog. These error codes will point you to specific error codes to filter against.
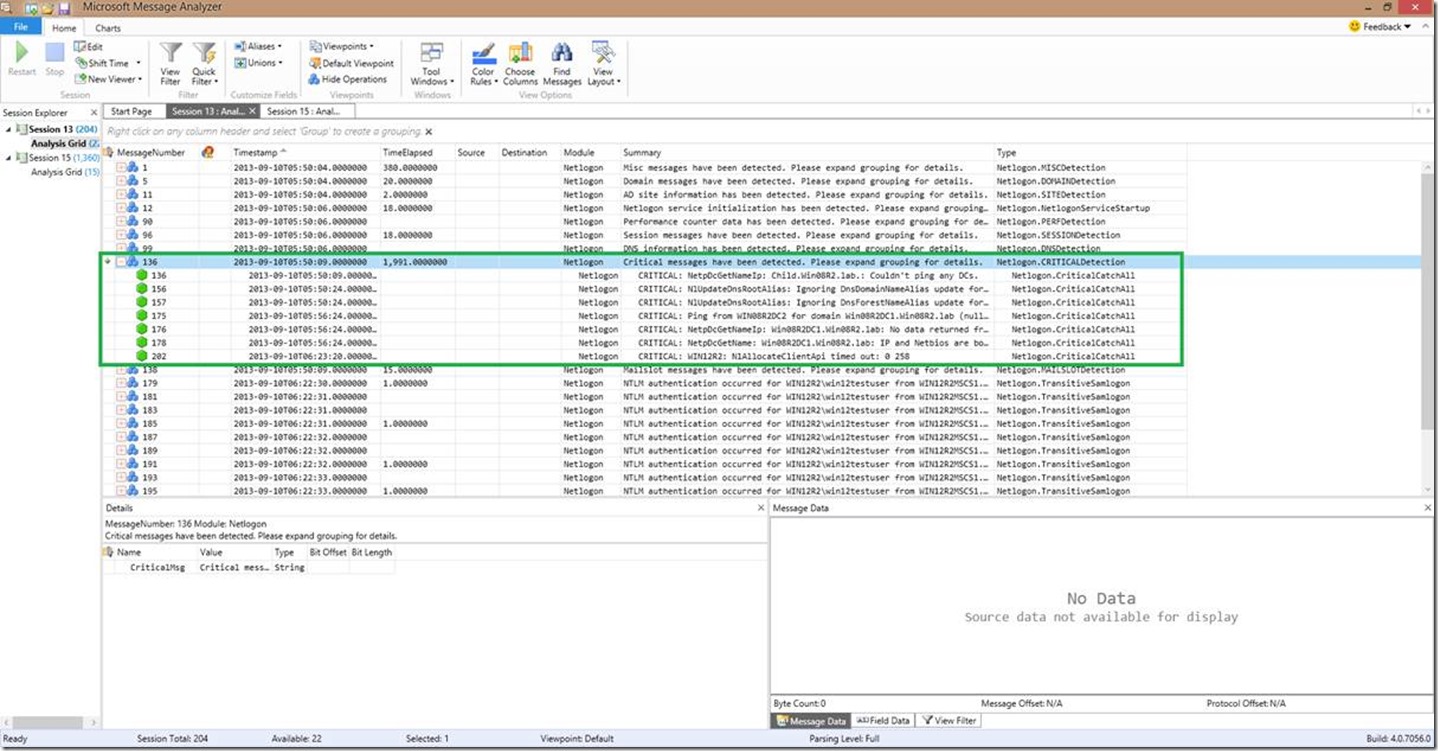
The first thing to think about here is that critical messages are usually interesting!
Many times, the critical messages will contain the most useful troubleshooting information. Not everything interesting in the logs comes back as critical, but it can most certainly point to some problems. If you look at the above example for instance, you can see that we can’t ping any DCs and that no data was being returned from a DNS query for the domain controllers. In the real world, this is a major problem!
The second thing to remember is that trending can be pretty darn useful! There are many MANY times trending can be useful. Let’s say for instance that you are troubleshooting an authentication problem and have been given a problem user name. Well that username is a key that you can use for filtering to identify the behavior trend for that specific user account.
Another scenario might be that you want to track down communications with a specific machine or domain controller to evaluate whether or not there are problems on that front. Well in that scenario, the machine name (or domain controller name) becomes a key that you can use to filter on to trend for that specific machine or domain controller.
When we go through filtering, you’ll understand the trending a bit better… We did our best to simplify filtering so you can filter on anything contained in the summary (where we kept most of the important information), or use any of the variable names (nlts, userName, domainName, machineName, machineName1, etc, etc). Multiple ways to achieve the same goal…
So our next stop is filtering on error codes and other keys…
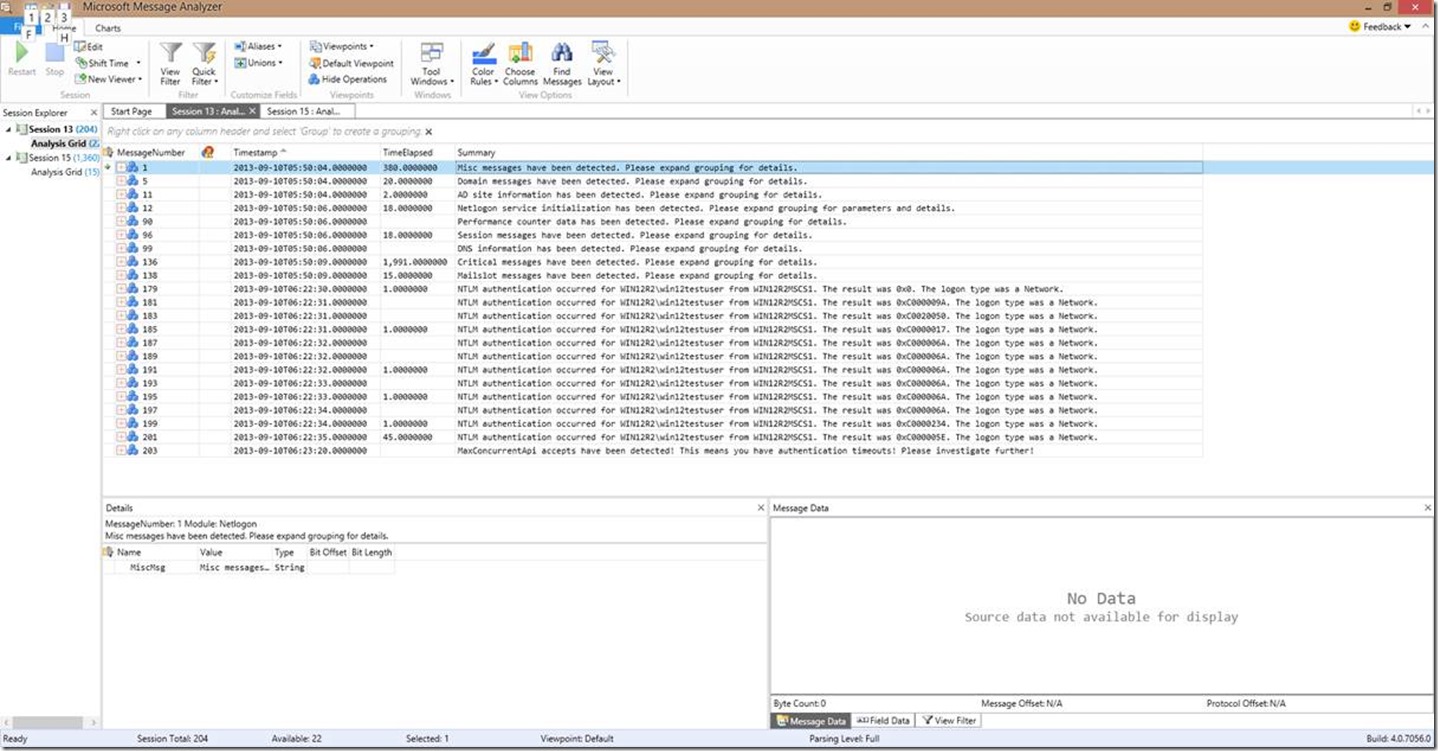
Let’s start from scratch here…we’ve just opened a Netlogon log in Message Analyzer, and this is what we see:
Now, what do we see that looks out of place just at a glance. Let me tell you what I see…I see we have multiple different errors for authentications of some user in the WIN12R2 domain named “win12testuser” logging on from some machine named WIN12R2MSCS1. I can also see a MaxConcurrentApi issue occurring.
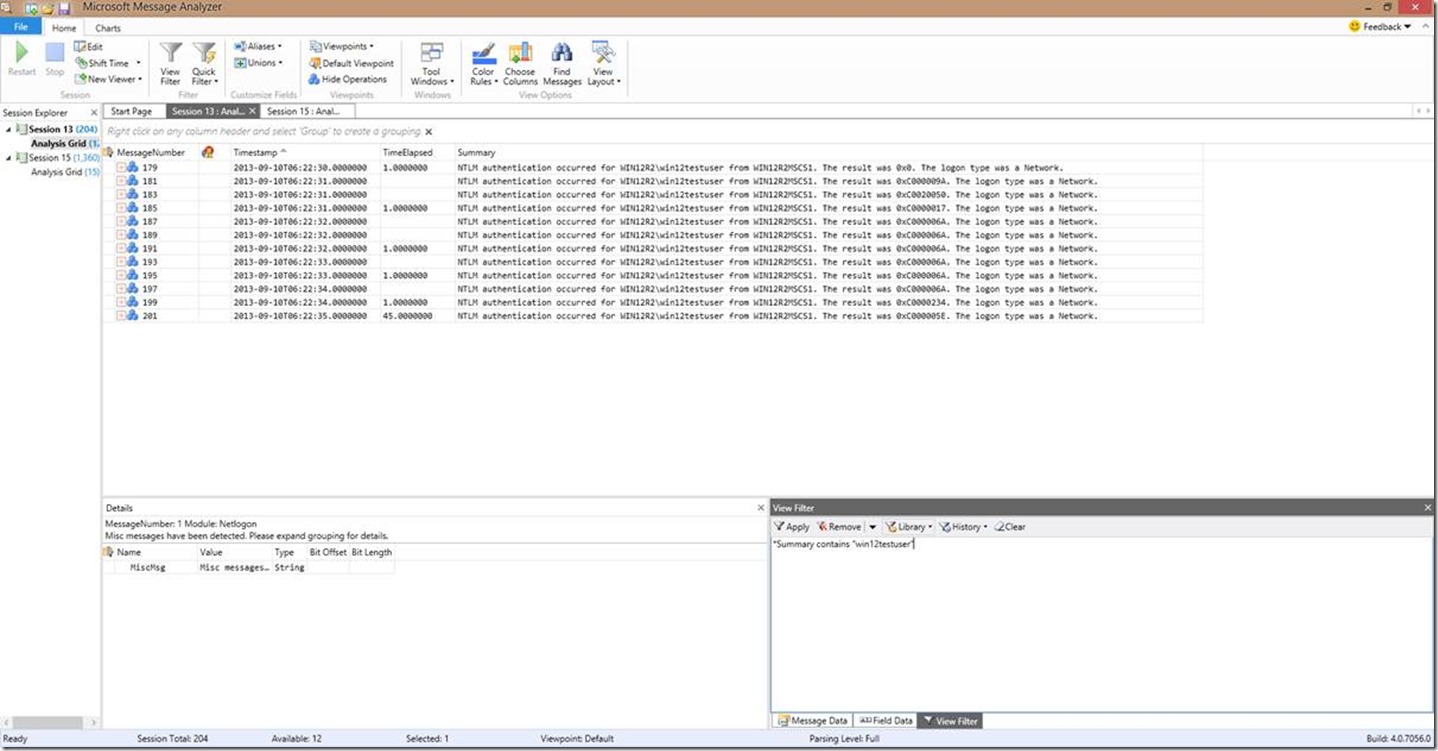
So let’s say I want to trend this user “win12testuser”. To do this, I can change the over to the View Filter tab in the data window (lower right). In this case, the filter I want to use is *Summary contains “win12testuser” , and then I’ll click apply. This will give me a view like this:
Now from that filter, I’ve successfully trended that specific user account, and I can see the success and failure of that user. I could apply this to any string I want.
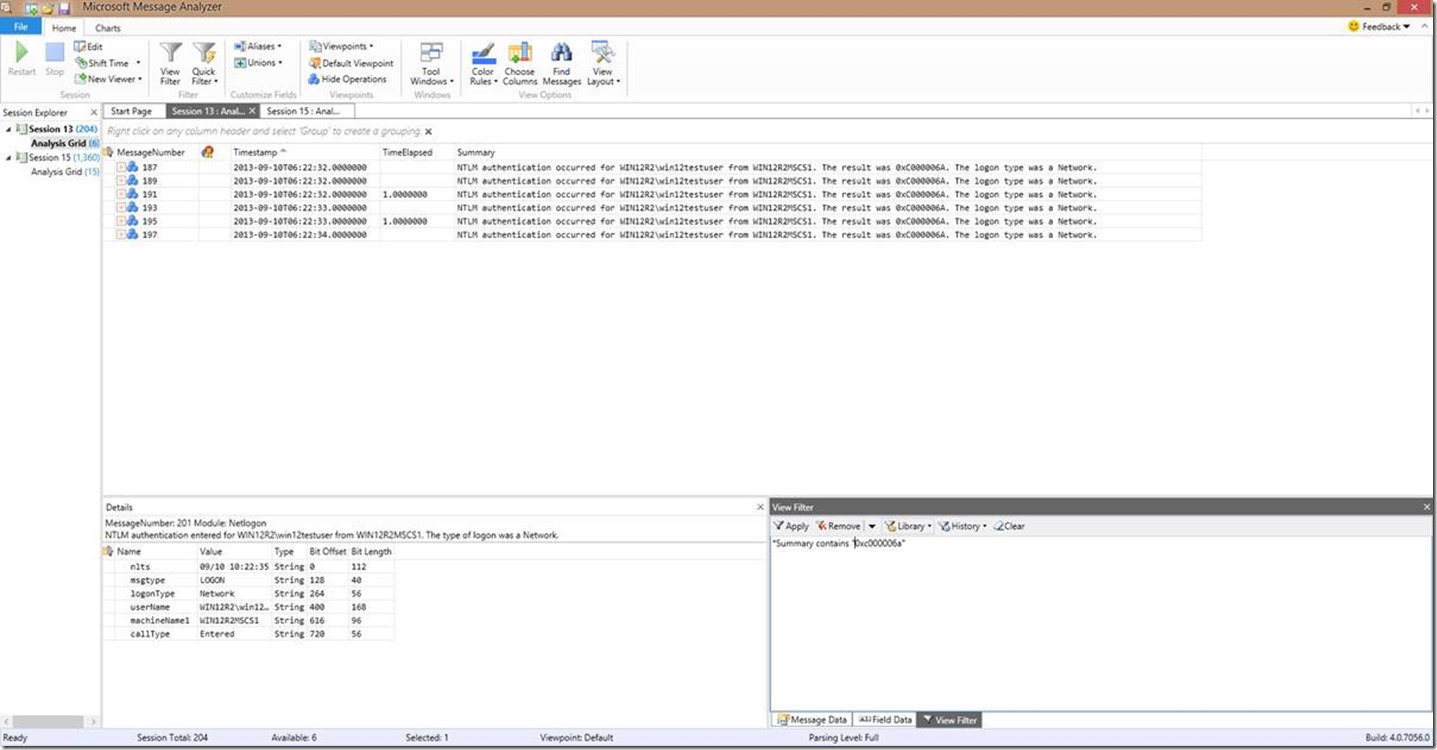
Now let’s pretend that the “win12testuser” account got locked out, because, well, in our example above it does! If I wanted to see the invalid password attempts that led up to the problem and where they came from, then I could filter out the appropriate error code as seen in the below screenshot. The filter in this case is *Summary contains “0xc000006a” . NOTE: Since I have the same machine name for all the authentication calls, the window still looks pretty much the same with the exception of the view filter and any other error codes are now gone.
Typically in this scenario I would be looking for the machine name the account lockout came from so I would know where to continue my investigation, but that’s not the point of this blog, so for now, we’ll just assume you know how to troubleshoot the scenario.
Now let’s take at another way I could have found that error code…it gives the same results, but the filter this time is different. This time I’m using the filter Netlogon.errorcode = “0xC000006A” (NOTE: You can also use “==”). Note that when using this method, capitalization in the string (“0xC000006A” in this case) needs to match the variable you are searching on. In this case, we searched on the errorCode variable, but the same would apply for machineName1, userName, etc etc….any variable you are filtering on WHEN YOU ARE USING THE EQUALS “=” or “==” symbol in the filter in conjunction with the Netlogon parser.
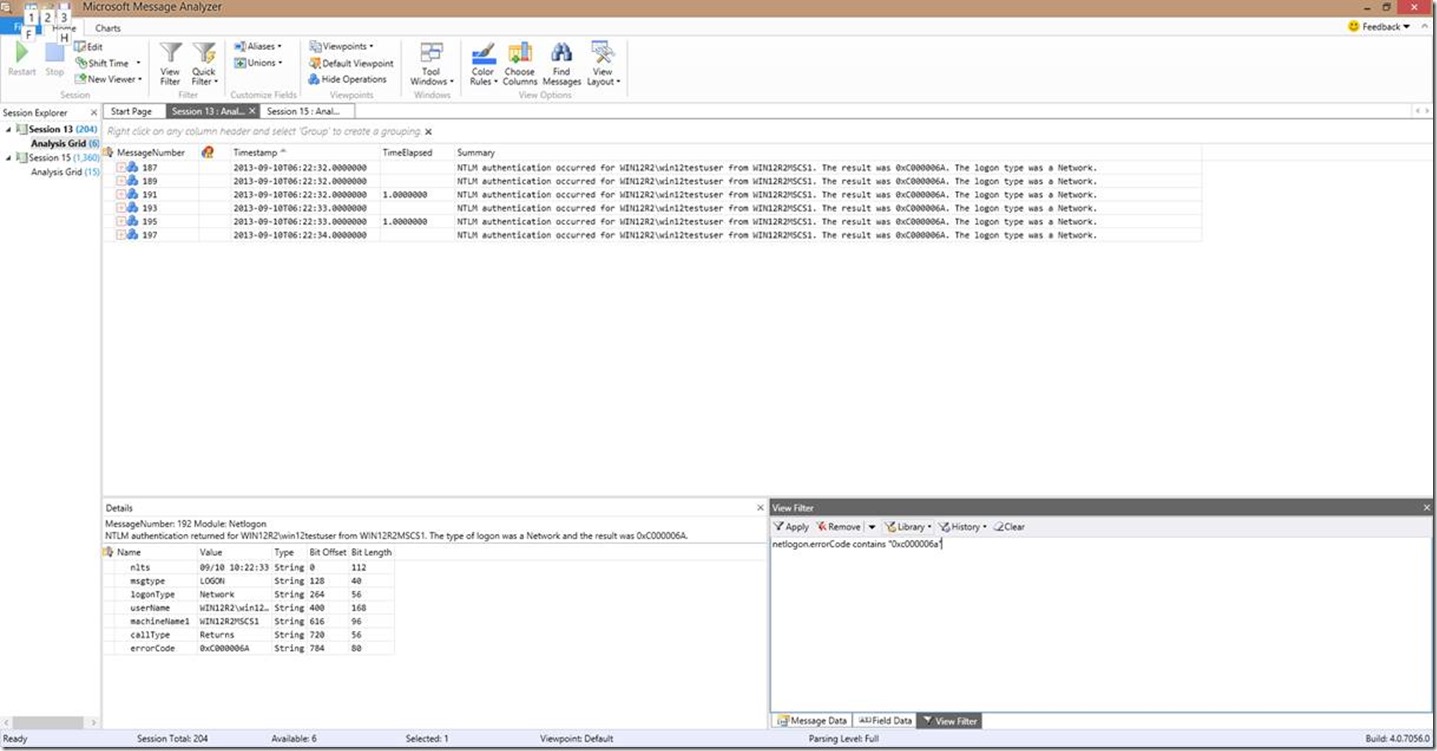
Or we can use yet another method of filtering using the contains filter. When using “contains”, the capitalization does NOT need to match like it does when using the equals “=” symbol. In this example, the filter I’m using is Netlogon.errorcode contains “0xc000006a” .
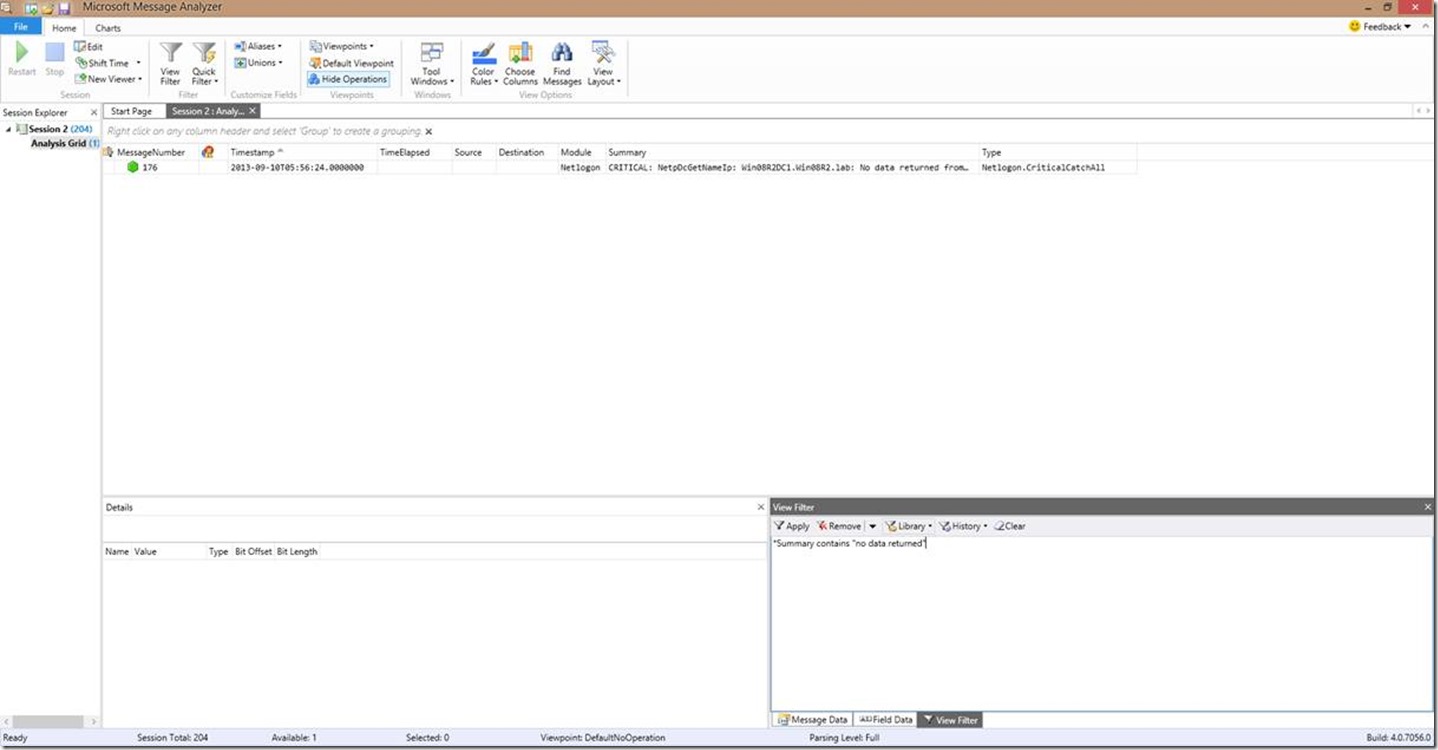
Now let’s expand this a bit away from a specific error code. Let’s say I want to look for a phrase such as “no data returned”. Based on the filtering we’ve already covered, can you guess our filter??
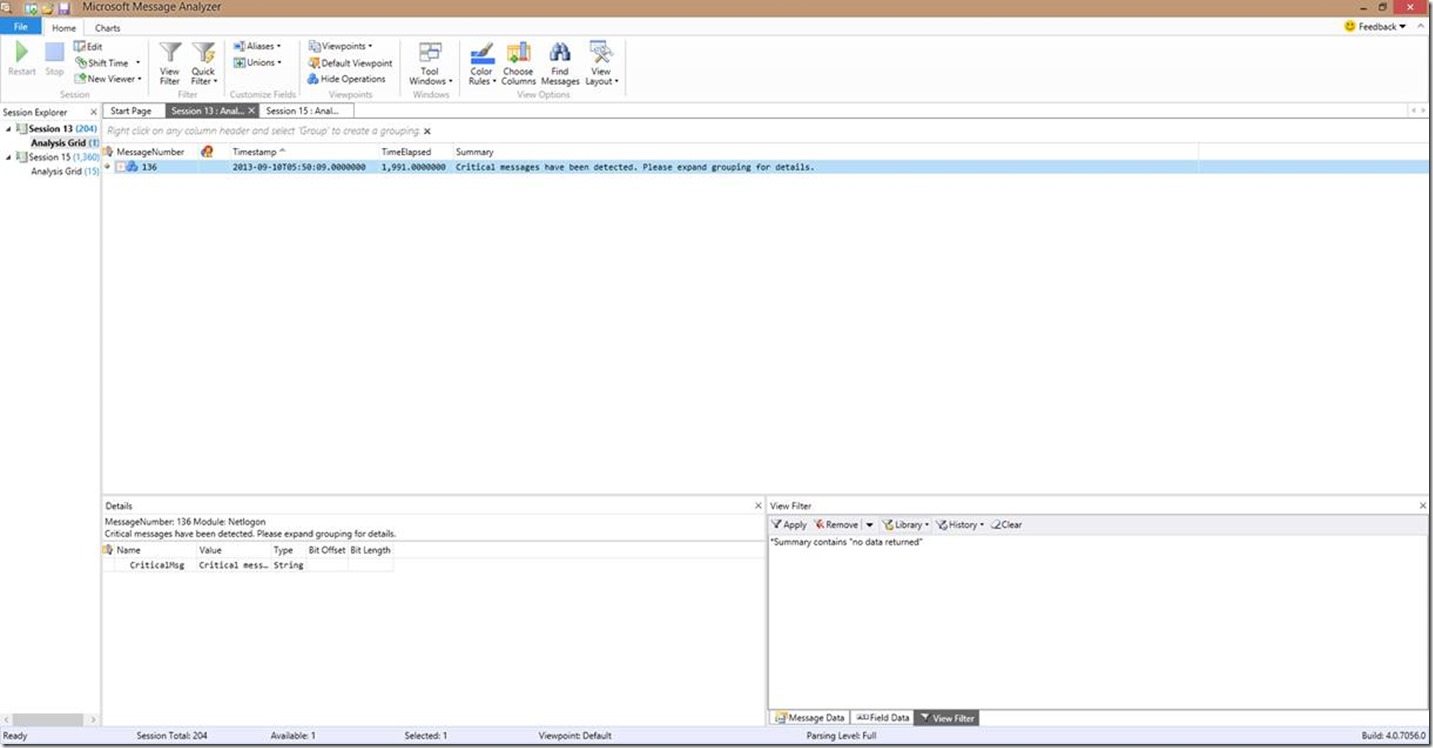
That’s right you guessed it, the easiest filter in this case would be *Summary contains “no data returned” .
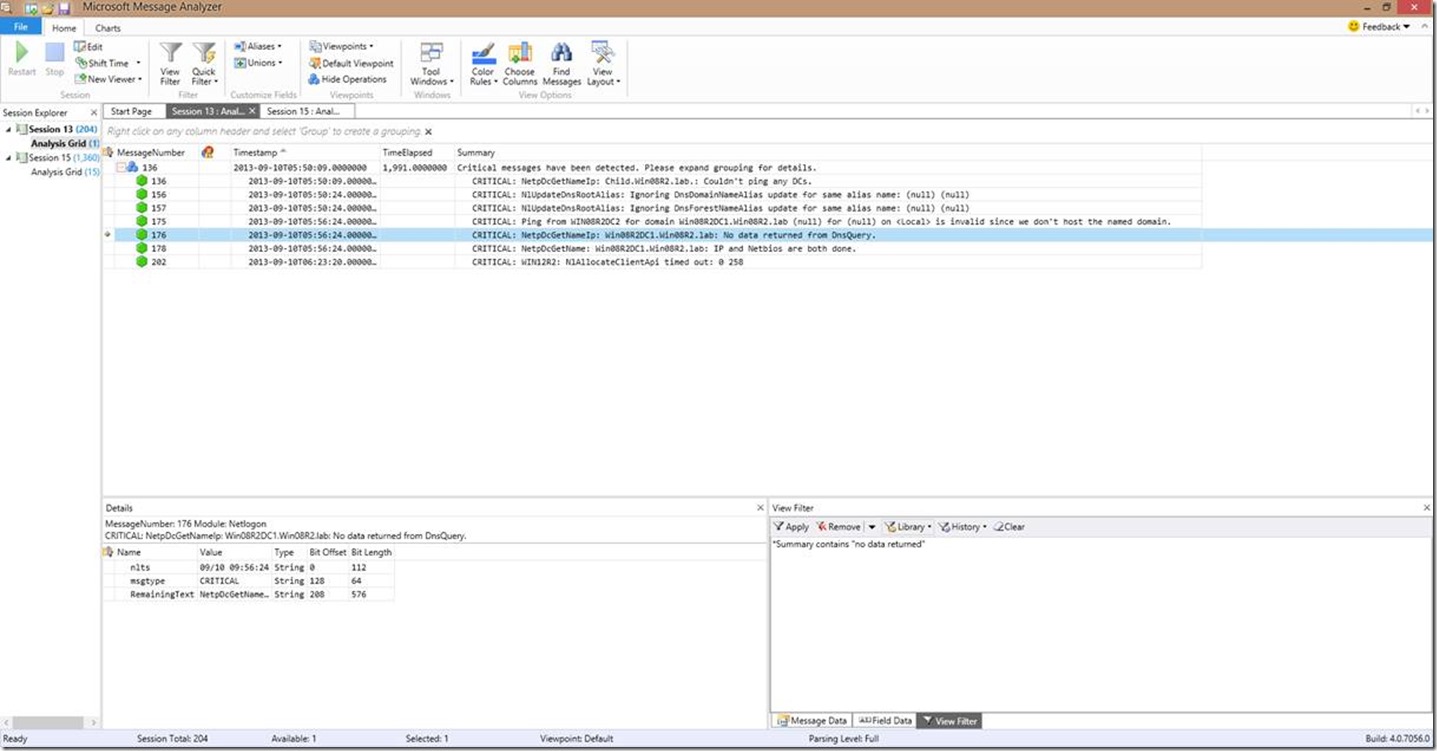
Now you’re probably saying “Hey wait a minute Brandon! I plugged in this filter and all I got returned was this grouping of critical messages!”. So why is that you ask? That’s because we have operations turned on/enabled, and the string we’re searching for is in that operational grouping. If we expand that grouping, we can zoom in a bit better. Or of course, you could also hit the “Hide Operations” button to get the individual line views.
Now look what we have here…that’s the string we were looking for!
Conclusion
So now that we’ve gone through all of this, you should have a much better idea on how to start sifting through your data to find your conclusions. You can trend, you can filter, and you know exactly why the Netlogon parser can tell you about your RPC port exhaustion and MaxConcurrentApi issues. Next time, we’ll start digging into more specific areas for troubleshooting in our advanced troubleshooting topics.
Thanks for joining me yet again, and I’ll see you next time!
-Brandon “Long Winded” Wilson
References
Message Analyzer v1.1 download
https://www.microsoft.com/en-us/download/details.aspx?id=44226
Introducing the Netlogon Parser (v1.0.1) for Message Analyzer 1.1
Quick Reference: Troubleshooting Netlogon Error Codes
Quick Reference: Troubleshooting, Diagnosing, and Tuning MaxConcurrentApi Issues
Message Analyzer Forum
https://social.technet.microsoft.com/Forums/en-US/home?forum=messageanalyzer
Message Analyzer blog site
https://blogs.technet.com/MessageAnalyzer
Roaming AD Clients, with an Updated Script
