Becoming an WPA Xpert Part 10: WPR and the Command Line
Hey y’all, Mark back with another update in our now long running series, Becoming an Xperf Xpert. First some housekeeping. This series is going through a name change. As we wrote in Part 6 that Xperf is dead, long live Xperf! It was time to start using Windows Performance Analyzer (WPA). All posts since then have used WPA to analyze the trace but we’ve still called it Xperf to ease everyone into it. Much like how my mom still “tapes” stuff on her DVR and I try oh so gently to correct her, she’ll eventually get to “record”. Today is that day for WPA. Out with Xperf, in with WPA. So this series will still be the same we are just going to start calling it the correct name so behold, Becoming an WPA Xpert was born.
A while back James Klepikow showed us how to take a trace using WPR. Shortly after we got a comment about how to do this from the command line. I agreed that would be an interesting post, then I forgot about it for almost a year. Then a customer asked me how to do it and it all came flooding back to me which brings me to the point of this post, using WPR from the command line. Let’s get to it.
Xperf -Providers
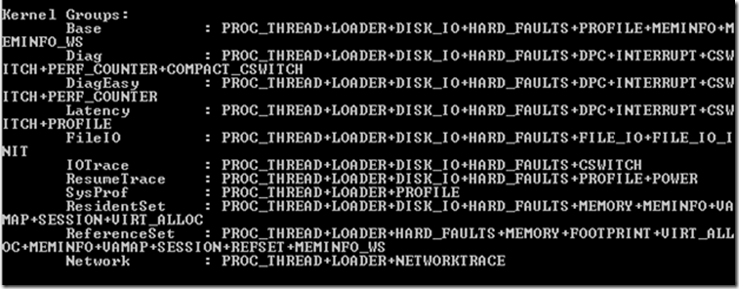
Most people had a pre-built xperf command line they’d run in a batch file based on the kernel groups.
To get this info, and lots of other providers you simply ran xperf –providers decided on what data you wanted to collect and passed those flags along. You then created a batch file with the start command and which providers you cared about. Simple enough.
WPR –Profiles
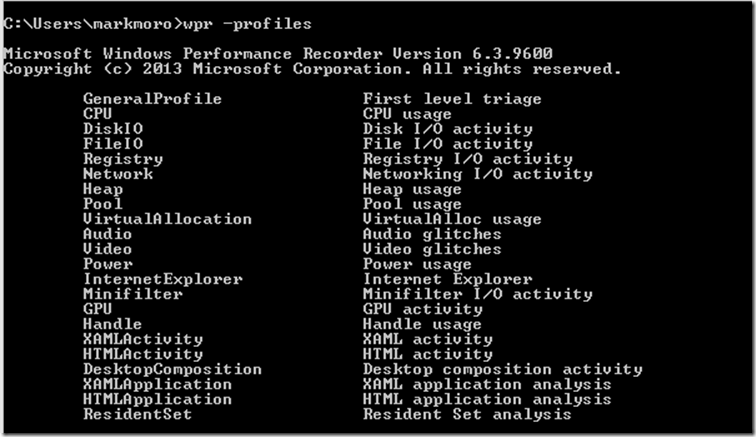
To get this same info with WPR simply run WPR –Profiles
Just plug these profiles in for what you were capturing in the xperf commands and you should be good with ‘wpr –start GeneralProfile’. But what if we want more than one profile. Simply start them. For example if I wanted both the GeneralProfile and the CPU I would run the following command.
‘wpr –start GeneralProfile –start CPU’
To stop the trace you’ll run ‘wpr –stop filename.etl’
What about XBootMgr
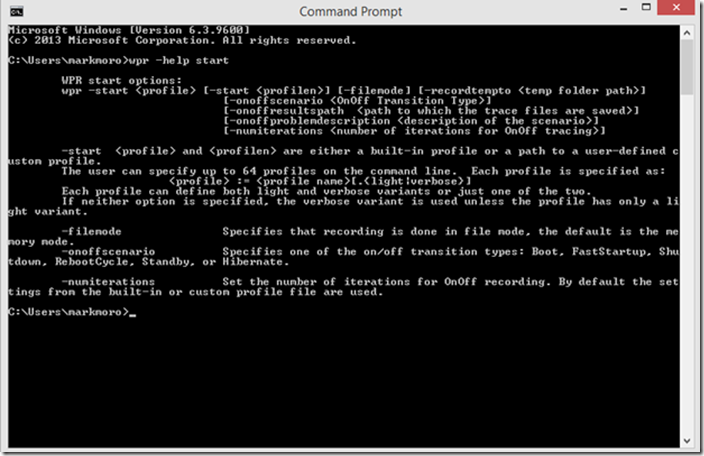
Much like xperf the xbootmgr command shouldn’t be used, use WPR instead and it’s going to be pretty similar to the commands above. First you’ll start by picking which profiles you want to collect data about. Then you’ll pick what scenario we are interested in, boot, shutdown, etc. Then finally how many iterations. Again this is what you are already specifying in the GUI. In this example we are focusing on boot and we want to do 1 iteration.
It will then reboot just as expected. For more information run ‘wpr –help start’
The Right Tool for the Right Job
There are few things I know in this life. First is if I ask for no mayo on a sandwich there is a really good chance it will have extra mayo on it. The second, when you get a shiny new hammer, everything is a nail. I frequently see customers get really really excited by WPR/WPA and that’s great. However they try to use it for EVERYTHING. Let’s automate collecting all this data to troubleshoot every issue. Then all other troubleshooting procedures go out the window and we’ll spend lots of time digging through a trace looking for that needle when the issue has been logging to the event viewer the entire time. Remember WPR/WPA is another tool in your tool belt, not everything requires your brand new hammer. Hopefully this quick post helps finally answering the question posed many months ago, how do I run this from the command line. What other WPR/WPA info are you guys after? Let us know in the comments. Turnaround time should be faster than a year this time. Should be….
Mark “Hold the banana peppers too while we’re at it” Morowczynski


