Becoming an Xperf Xpert Part 9: Where’s My Network? (With Stack Walk)
Hi everyone Randolph (Randy) Reyes with another SBSL blog post. In this particular engagement we went onsite to deliver a workshop in how to utilize the Windows Performance Toolkit (XPERF) to detect slow boot and slow logon issues.
The Before
PreSMSS |
SMSSInit |
WinlogonInit |
ExplorerInit |
Post Boot |
8.165 |
2.454 |
63.305 |
1.950 |
11.400 |
Boot to Post Boot Activity ended: 87 Seconds and 273 Milliseconds = 1 Minutes and 27 Seconds
If we expand this out for their main office of 3,000 Computers we get.
3,000 Computers x 1 minute and 30 seconds= 3,500 minutes every working day
Now you might be saying to yourself, 1 min and 27 seconds is not too bad. What if I told you it was a SSD (solid state drive)? Would you consider this to be an optimal value? I’ve discussed optimal times in a previous post, “Becoming an Xperf Xpert Part 7: Slow Profile Load and Our Very First Stack Walk”
Those values don't line up with what we expect to be seeing so its time get to the bottom of this.
After adding the graph for Boot Phases and also Generic Event we can see that most of the Winlogon Initiation Phase time is been consume by the Subscriber Profiles under the Microsoft-Windows-Winlogon provider. In the picture below we can see when the Subscriber Profile started at 34.167 and ended at 68.002 of the trace.
First question you need to ask yourself. Why Profile is taking that long load?
Are we using Roaming Profiles or do we have a local profile in this Windows 7 System?
What’s going on with my Profiles?
To be able to understand what’s going on we need to turn into “Stack Walking”
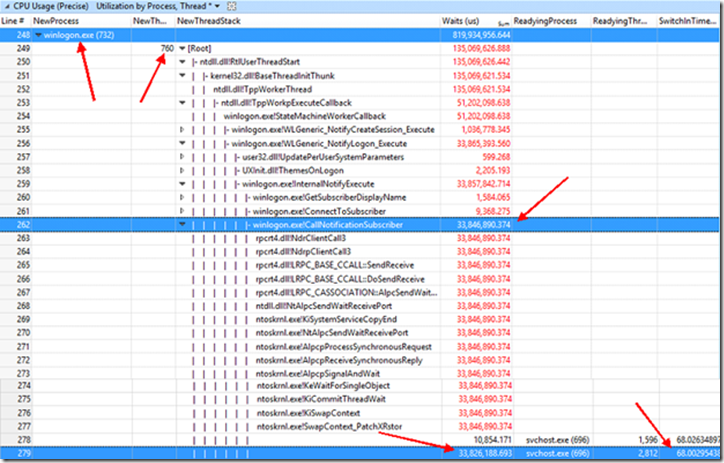
We need to make note of the Process “Winlogon (732)” and Thread (760) so we can do wait analysis against this thread to see what is taking almost 33 seconds.
Also make sure to click in the Trace tab to Load Symbols, if you don’t load the symbols you will see the call stack recorded, but the details of what the code was executing will be hidden. (Call stacks will show DLL names followed by question marks).
Taking the process and thread information, we’ll use it in the “CPU Usage Precise” graph (based on Utilization by Process, Thread).
I recommend the order NewProcess, NewThreadID, NewThreadStack, Wait (us), ReadingProcess, ReadyingThreadID. SwitchInTime(s). These can be added or removed from the Line # menu.
After adding the graph “CPU Usage Precise” graph (based on Utilization by Process, Thread) we expanded process Winlogon (732) and inside this process we follow the thread (760)
In the Graph below we can see the CallNotificationSubscriber with a single call that took 33 seconds (Profiles)
Here we can see that Winlogon is waiting in Svchost.exe operations.
We can observe that the switching time in svchost.exe 696 was 68.002 seconds (exactly the time “Profiles” ended, so we are on the right track.
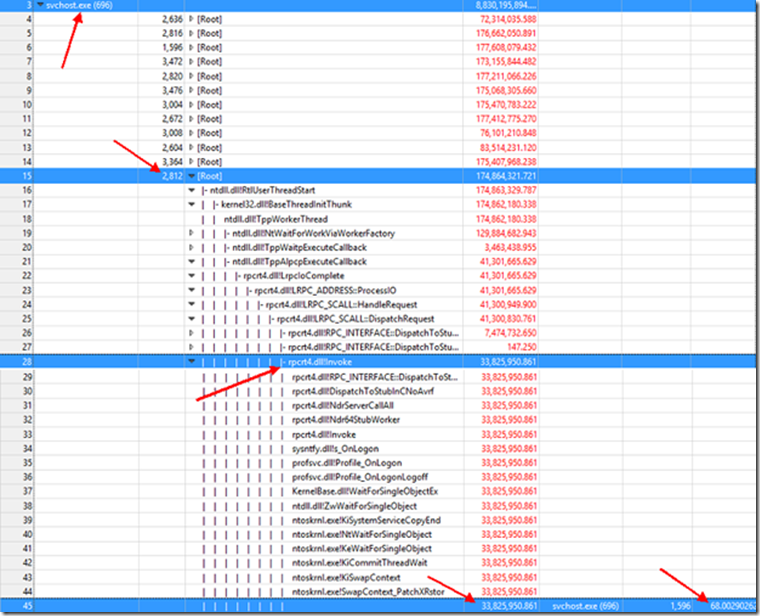
Using the same graph “CPU Usage Precise” graph (based on Utilization by Process, Thread) we expanded process svchost.exe (696) and inside this process we follow the thread (2812)
Remember we are looking for a delay in time of 33 seconds
Looks like we are waiting on some kind of network communication operation (rpcrt4.dll is the Remote Procedure Call (RPC) API, used by Windows applications for network and Internet communication).
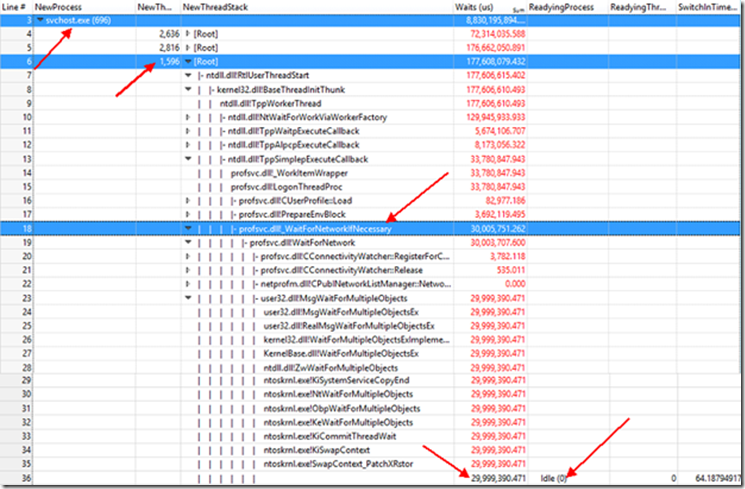
Now, we need to follow the thread 1596, inside the svchost.exe (696).
Once we arrive to “Idle (0)” we are at the end of the stack.
Looks like the profsvc.dll (Provides User Profile Services service = Data and Components) waited 30 seconds for Network to be ready.
Now the big question is why profsvc.dll is waiting 30 seconds for network?
It could be that we were not able to contact a Domain Controller since this is a domain joined machine, we should.
When a machine is a domain joined, we depend on NLA to tell us whether it has domain connectivity or not so that we do not miss the opportunity to apply policy at boot or user logon even when the machine is connecting from home. When NLA cannot determine whether it has domain connectivity or not then we wait for ~30s to allow for network to come up.
The Fix
Step 1 = for testing purpose we connected system to LAN and system booted with in the expected values. (30 Sec less)
The After
Boot to Post Boot Activity end: 46 Seconds and 643 Milliseconds
(Note: In this particular engagement we still have other areas that will improve boot time in this particular systems but those will be posted in another blog.)
Before
3,000 Computers x 1 minute and 30 seconds= 3,500 minutes every working day
After
3,000 Computer x 46 seconds = Around 900 minutes every working day.
Recommended Articles
Here is another blog from a good friends and fellow bloggers Yong Rhee, Mark Morowczynski and Charity Shelbourne
Troubleshooting Windows Performance Issues Using the Windows Performance Recorder
WPT: Using WPT (Xperf) to enable Storport ETW Performance Logging
Becoming an Xperf Xpert Part 2: Long Running Logon Scripts, Inconceivable!
Randy “Dude, where’s my network?” Reyes


