Domain and DC Migrations: How To Monitor LDAP, Kerberos and NTLM Traffic To Your Domain Controllers
Hi everyone Adrian Corona here, this time I’d like to talk about a scenario that I get asked about a lot: Domain / Domain Controller Migrations.
A very (if not the most) important piece of a successful migration is to know when there’s a system or application still using your domain services before decommissioning your domain / domain controller.
Usually IT departments will have visibility of the most important applications in the environment as well as any specific configuration (hard coded IPs, server names, etc). However it is very common to have not-so-important services using AD and not having any documentation (or even knowledge) about them. It’s also very common to not have any documentation for those important services :).
One the most common question I get from customers is: “How can I monitor if there are applications still using my domain?”
This question extends too many scenarios such as domain migrations, consolidation or simple curiosity. Maybe you want to build that documentation you were missing. Seriously please do. Regardless of your scenario, it is very important to know which systems are using your domain controllers and for what.
A data collector set is a component that leverages and consolidates different sources of performance information into a single view. A Data Collector Set can be created and then recorded individually, grouped with other Data Collector Set and incorporated into logs, viewed in Performance Monitor, configured to generate alerts when thresholds are reached, or used by other non-Microsoft applications in other words, awesome!
I won’t get into much detail on how the DCS works but I’ll show you how to use them to get key AD information from your domain controllers. We’ll be taking advantage of ETW tracing which is very powerful, you can read a lot about it here.
Note: For this to work correctly you’ll need to run this part of the process from a domain controller. In this example I’m using a 2012 R2 DC but the process should be the same for 2008 and 2008 R2, unfortunately this process doesn’t apply to 2003 DCs, for sure you can use SPA and get similar information but the good thing is that you’ve got rid of those old 2k3 DCs right?
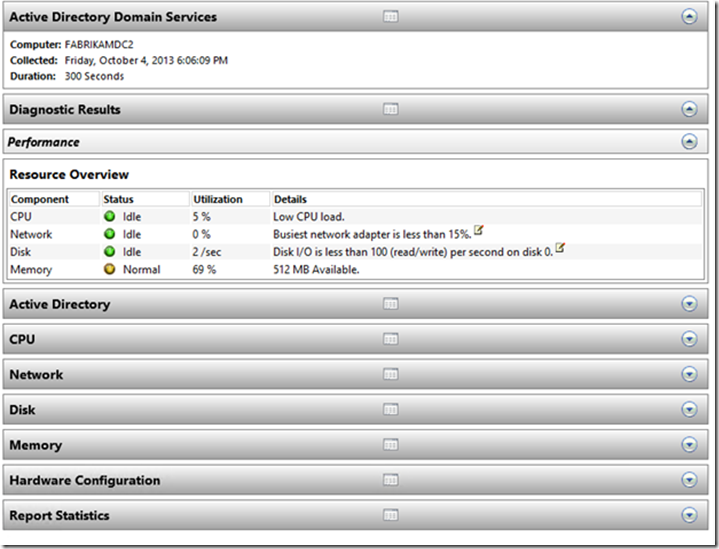
Data collector sets are very useful, there are built-in collectors and the reporting is great, for instance I can start the Built-in Active directory Diagnostics collector and it will run for 5 minutes (if you want to change that you’ll need to create your own DCS ) after finished, you can see this awesome reports which will show you very important information about your domain controller’s performance.
This looks great but the only problem is that this reports are limited to a maximum number of results, however the data on the ETW trace is there so there must be a way to take advantage of it, let’s see how.
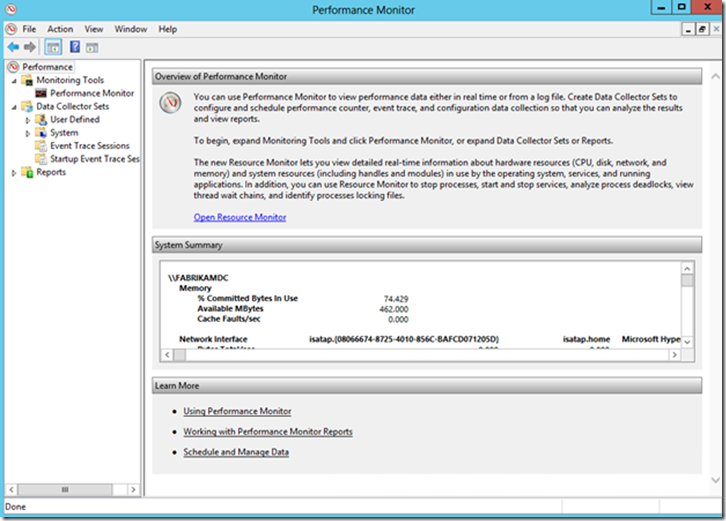
First begin by launching Performance Monitor:
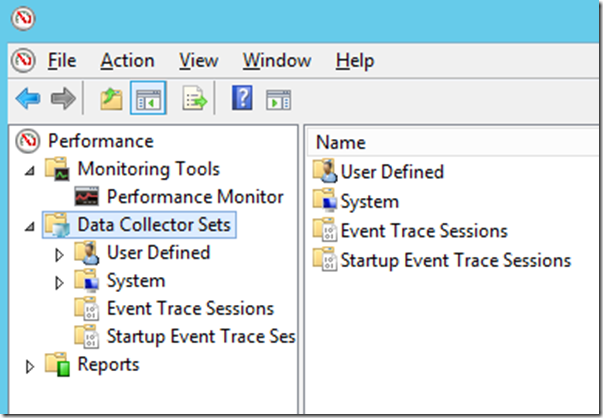
Expand Data Collector Sets:
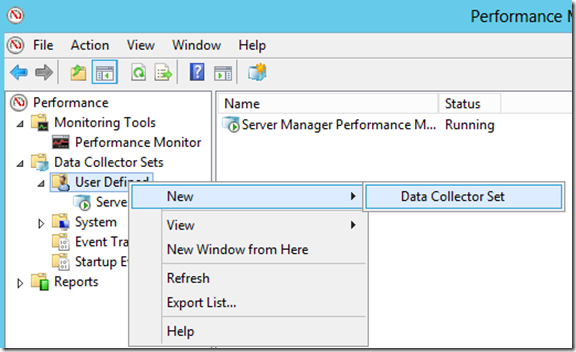
Right click User Defined – New – Data Collector Set
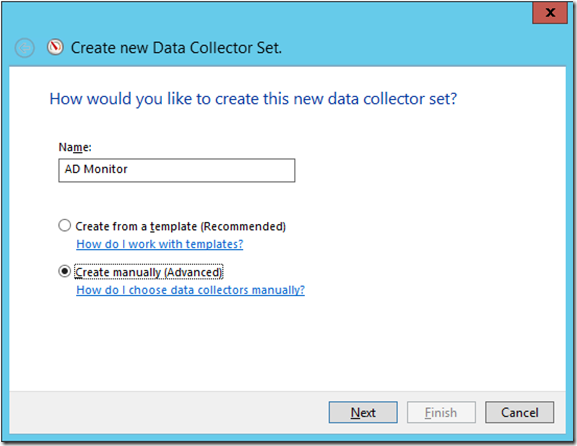
Type the name you want to add to the DCS, select Create Manually (Advanced) and click next:
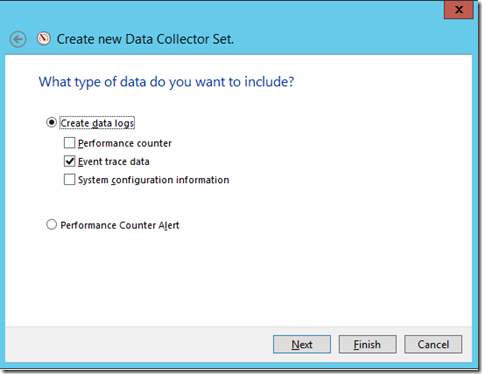
Select Event Trace Data:
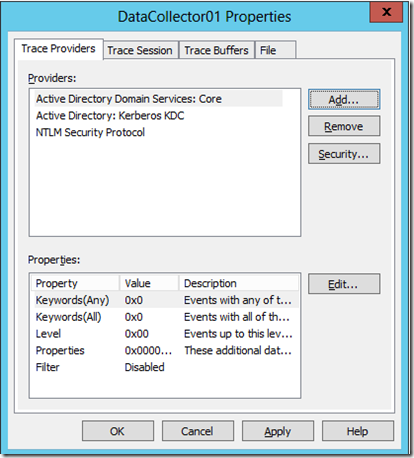
On the Event Providers click add and select the following providers:
- Active directory Domain services: Core
- Active Directory: Kerberos KDC
- NTLM Security Protocol.
Note: there are many more providers available, you can customize your monitoring to anything you want to include, just bear in mind that the more providers you add the larger your file will grow.
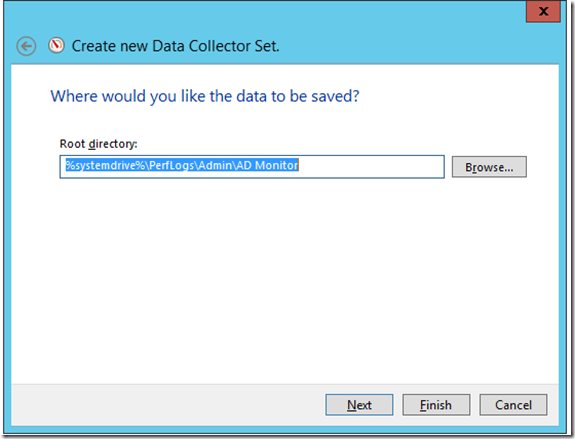
Click next, select the path where you want to save this file and click finish.
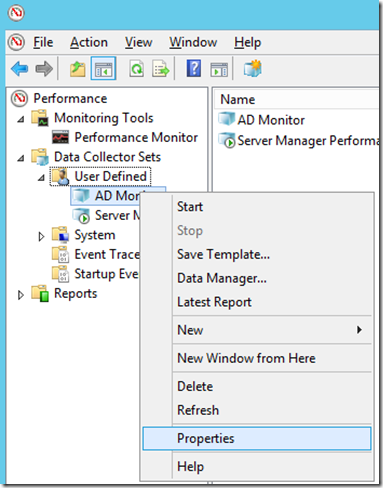
On Perfmon console right click your newly created DCS and select properties:
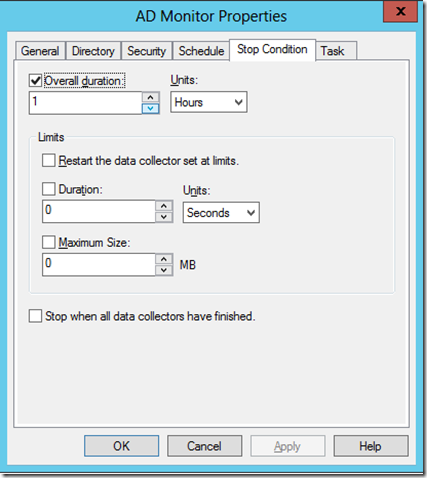
In this window you can configure many options but we are interested on the stop condition which tells your system how long you will be collecting information.
Warning: DCS ETW grows very fast in a heavily utilized system a 5 minute trace grew ~100MB so be careful where do you place this file, also you want to run this process when there is the most user activity.
In this case I will be running my test for 1 hour:
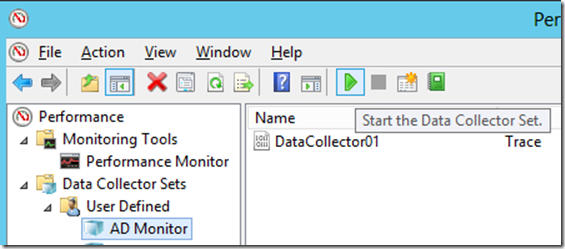
After your collector is created, select it and click start on the toolbar:
After the data is collected you’ll have a file called datacollector01.etl, if you try to open it you’ll only see garble since this file is in binary format, so what can I do to read it?
Don’t worry, “After a while you don't even see the code anymore”.
If you are not as advanced as Cypher here you can always use tracerpt to convert this files to a human readable and convenient CSV file.
For that, open up an elevated command prompt on the Domain controller and run the following command:
Tracerpt –l “file.etl” –of CSV
If you run this command on other machine the providers might not be available and the events decoding will be incomplete.
When the process is done, you’ll have 2 files:
- Summary.csv – You can use this file to validate that all the providers were found, to do that just check that all rows on the eventname column are populated, if you have one or more empty rows, the system you used does not have the correct providers (which shouldn’t happen if you run this on the DC since it has all of them)
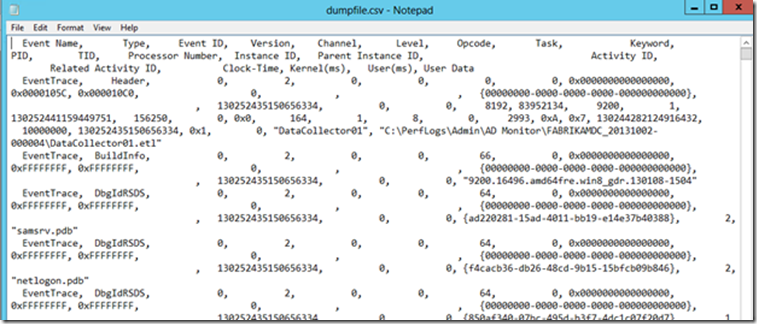
- Dumpfile.csv: this file contains the human readable information (or is it?)
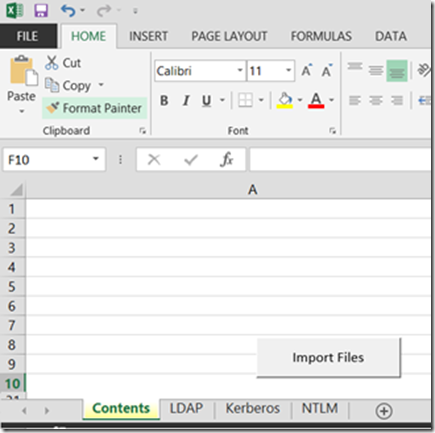
Panic no more, you can open this file with Excel and you’ll see a nicely formatted document that can filter and sort as you please, however it isn’t that convenient if I have to manually review all my domain controllers manually, so I created a simple macro that you can use to consume this file and give you a nicer format (as of the moment of this writhing this macro can process one file at the time), the only thing you have to do is follow this steps:
1. Download the Import-DC-Info.xlsm document attached at the bottom of this post. It works with Excel 2010 and 2013.
2. Place the document in the same folder where you have the dumpfile.csv
3. Open the file and if necessary enable macros.
4. Click on Import File.
5. Sit down and relax.
After this process is done you’ll have and excel file called DCInfo.xlsx with some tabs and pivot tables created:
LDAP.
It contains a list of all the LDAP queries performed against your DC with a list of IP (with duplicates removed), IP:Port combination and also the query that was executed, with this you can see who is requesting what info and from what IP this query was originated.
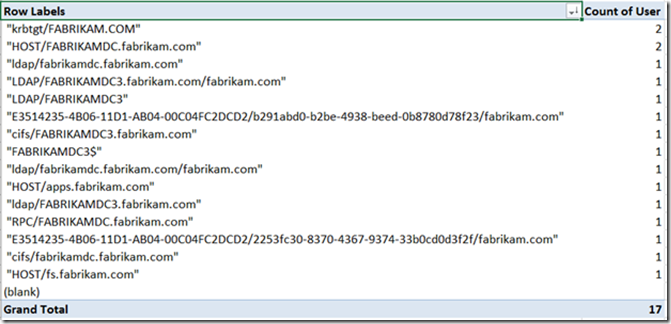
This is a Pivot table populated from the Kerberos tab which is sorted by the total number of hits to a particular service, this table is helpful to have a quick glance of what service is still using Kerberos authentication. To get this information I filtered and cleaned up the TGS-Start requests, I excluded the AS requests since they could potentially increase the number of results and we won’t gain much additional information by including it.
Kerberos.
This table is a consolidated (and duplicate removed) list of all the TGS requests made, you’ll use this tab if you want to see more detail from the pivot table, more specifically the User column will show you the actual user/computer/service account that is requesting a service while the service column indicates what service is being requested. Take for example the following row:
FabrikamDC3 is a domain controller that is requesting a Kerberos ticket to access a file share on fabrikamdc (probably Sysvol contents)
NTLM-Pivot.
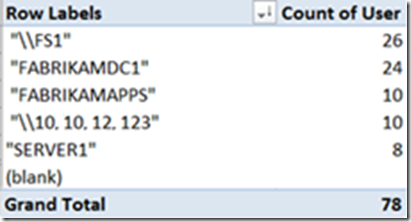
This table is very similar to the Kerberos-Pivot, it will give you a list of the total number of NTLMValidateUser requests being performed from clients to services.
NTLM.
A full list of every NTLMValidateUser requests, similar to the Kerberos tab.
As I explained earlier, this process should be performed from all your DC’s preferably during the same time window so you’ll have unique authentication requests and queries logged. If you log information from different DCs at different times you might get the same client(s) hitting different DCs thus, duplicated information.
If your exported csv files are not very large, one suggestion is to manually consolidate all the exported data into one big csv, but beware that a huge file might consume a lot of memory and will take longer to process, if time is not necessary a concern, go for it!
The macro doesn’t have much error control but it will serve the purpose if it is used as instructed, the good news is that even if you don’t use the macro you still have great information that can be exploited anyway you like.
Keep tuned.
Adrian “ETW: Event Tracing for Windows not East to West” Corona.
