More PowerBI Desktop Mapping for the Unconnected
After working through some of the options for mapping data in Power BI Desktop when you don't have an internet connection, I wanted to do some more with the Synoptic Panel, in particular to see how best to make my own images and use them in Power BI.
It mostly turned out as I wanted to demonstrate the features and use cases I was thinking about, but it was a little more fiddly than I thought it would be.
Synoptic Panel from Custom Images
Export from Visio as a png file
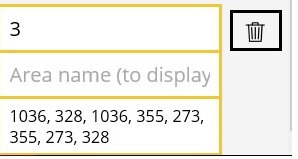
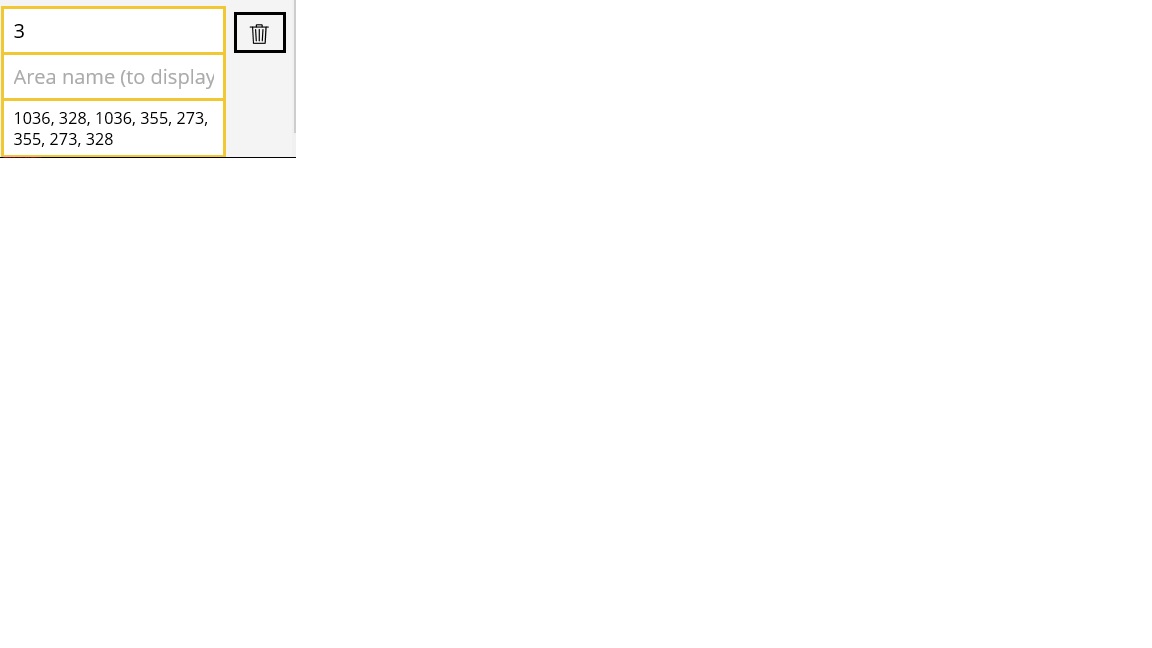
This turned out to be one of the easiest options I found after I tried a couple of other things. Once you have the .png file, setting up the regions in the Synoptic Designer is pretty simple, as long as you realize something I missed for awhile: You name the shape with the first box, the box which says "Area name (to display)" isn't what you want. I chased my tail for awhile assuming that the Area name was supposed to go in the second box. Turns out that name does get overlayed in the Synoptic Designer window while you're editing, but it's not the name of the Area.
This ends up being really important since you have to be able to reference the area with your data -- I took a simple approach and used an Excel spreadsheet with just a few columns -- and if you don't name it correctly, you won't get the results you want.
For my sample here, I opened Microsoft Visio and chose one of the templates which in the Basic Network group, the "Small/Medium Business Network Diagram". I think this is intended to show you a simplified diagram you can start to build with, which was great for a demo.
I decided to pick on three of the elements, a Server, a printer and a computer.
For the server, it was easy to use the "wizard" in the Synoptic Designer editor -- one click and it highlighted the shape I wanted. I named it ServerOne and then made sure my spreadsheet had a row for ServerOne with a value and a target and a description.
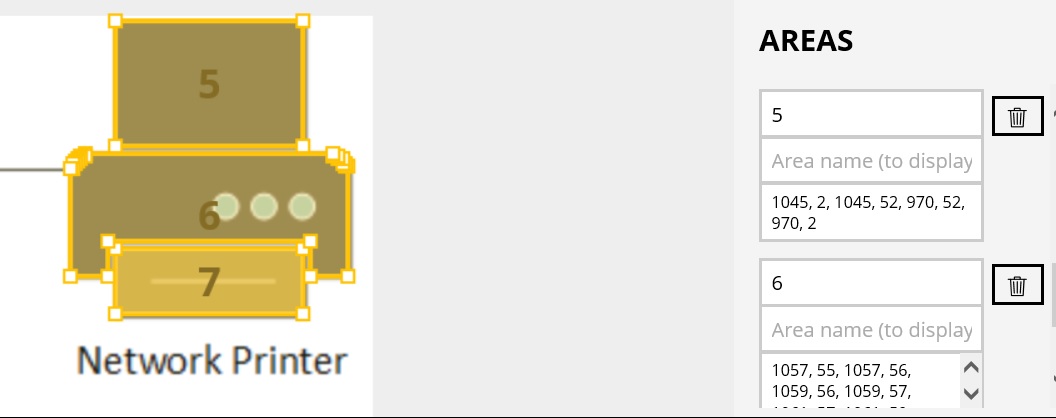
For the printer, the Visio shape is composed of a few shapes together. Luckily, this isn't too big of a problem, you can use the wizard and name multiple shapes with the same label - PrinterOne in this case.
Start with a png file
The other option is to start with a png file and upload that to the Synoptic Designer. I found map online which is several years old but shows some of the downtown area of Stuttgart, Germany.
If the map you choose has some well-defined contiguous areas, you can use the wizard to define them, but you'll likely want to also be able to use the "draw new areas" tool. Both work well, but defining a new area may work best if you're trying to indicate an irregularly-shaped area. It takes a little getting used to, but it's like other digitizing programs you may have used where it's trying to make sure there's a closed shape, so don't be surprised as you use it that you get an increasingly complicated polygon until you get back to the "start" of your shape.
Similar to the other visualization, I didn't put a lot of detail into the data here, I simply wanted to show that you could define your own regions and then allow for a filter and a table to highlight the data. I like that you can either use the filter -- single or multiple select -- and see the resulting region on the map, or you can click the region on the map and see the table values change in response. You can also hover over a defined region and see the data.
Clearly there's a lot of uses for visually walking through your data set, and I'll make another post soon to expand on this, but I wanted to share my experience with starting to define my own "maps" and using Power BI Desktop and the Power BI service to display that data.