Windows Server 2012 File Server Tip: New per-share SMB client performance counters provide great insight
Windows Server 2012 and Windows 8 include a new set of performance counters that can greatly help understand the performance of the SMB file protocol. These include new counters on both the server side and the client side.
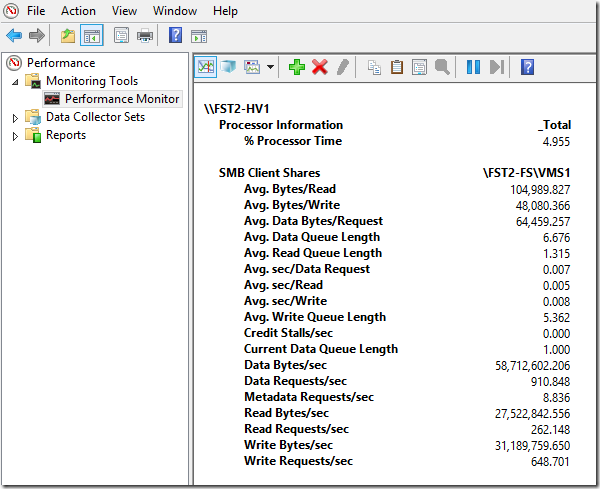
In this post, I wanted to call your attention to the new client-side counters that show the traffic going to a specific file share. In the example below, we see the performance counters on a computer called FST2-HV1, which is accessing some files on the VMS1 share on a file server cluster called FST2-FS. This is actually a Hyper-V over SMB scenario, where a VM is storing its VHDX file on a remote file share. I started a light copy inside the VM to generate some activity.

This simple set of counters offers a lot of information. If you know how to interpret it, you can get information on IOPS (data requests per second), throughput (data bytes per second), latency (average seconds per request), IO size (average bytes per request) and outstanding IOs (data queue length) . You can also get all this information for read and write operations. There’s a lot you can tell from these data points. You can see we’re doing about 910 IOPS and we’re doing more writes than reads (648 write IOPS vs. 262 read IOPS). However, we’re doing larger reads than writes (in average, 104KB reads vs. 64KB writes). Reads are faster than writes (5 milliseconds vs. 8 milliseconds). In case you’re wondering, the workload running here was a simple copy of lots of fairly large files from one folder to another inside the VM.
If you’re familiar with the regular disk counters in Windows, you might notice a certain resemblance. That’s not by accident. The SMB client shares performance counters were designed to exactly match the disk counters. This way you can easily reuse any guidance on application disk performance tuning you currently have . Here’s a little table comparing the two sets:
Type Disk Object Counter SMB Client Shares Counter IOPS Disk transfers / sec Data Requests/sec Disk reads / sec Read Requests/sec Disk writes / sec Write Requests/sec Latency Avg disk sec / transfer Avg. sec/Data Request Avg disk sec / read Avg. sec/Read Avg disk sec / write Avg. sec/Write IO Size Avg disk bytes / transfer Avg. Bytes/Data Request Avg disk bytes / read Avg. Bytes/Read Avg disk bytes / write Avg. Bytes/Write Throughput Disk bytes / sec Data Bytes/sec Disk read bytes / sec Read Bytes/sec Disk write bytes / sec Write Bytes/sec Queue Length Avg. Disk Read Queue Length Avg. Read Queue Length Avg. Disk Write Queue Length Avg. Write Queue Length Avg Disk Queue Length Avg. Data Queue Length
I would encourage you to understand your application storage performance and capture/save some samples after you tune your applications. This way you can build a library of baseline performance counters that you can later use for troubleshooting performance issues.