Custom Report Authoring for Beginners
Let’s face it. Operations Manager collects a lot of data. If we cannot generate reports about this data in a way that will help us make decisions, then we’re missing out on a lot of the value SCOM has to offer.
Most management packs do contain a set of generic reports that may be of some use, and we have the generic report library to leverage when we want to create a fairly basic ad-hoc report. But these canned reports usually don’t meet all the needs of our customers. This is why the ability to author custom reports, in my opinion, is one of the most valuable skills you can add to your resume as an Operations Manager administrator.
In this post, I will list the basic necessities for authoring a custom report, and then demonstrate how to create one.
What you need for report authoring
- SQL Server Management Studio
- SQL Server Business Intelligence Development Studio*
- System Center Operations Manager 2007 R2 Authoring Console (resource kit)
*I’ve been using the BI tool that is packaged with SQL Server 2005 installation media for years, but there are later versions available.
Steps to create a custom report
1. Create a SQL query (dataset)
2. Plug query into BI tool
3. Creating parameters for operator input
4. Format the report
5. Modify the data source
6. Plug the report into a management pack
Before you start
When you get the requirements for a new report, ask a lot of questions. Make sure there is a good understanding of what the requirements are and what is possible to include in a report. It is very important to scope the project and set expectations before starting anything, because once you’re deep into the development process it becomes more difficult to change the report definition as you progress.
Create a SQL query
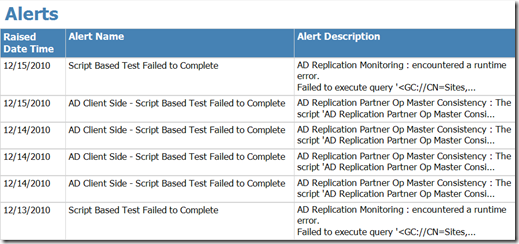
For this demonstration, we’ll create a very basic alert report. The operator will have the ability to enter an alert name as a parameter. The parameter will be used as the string in a literal expression. The report will contain alert name, description and time raised.
Open SQL Server Management Studio, connect to the Data Warehouse and create the query, which will look something like this.
 SELECT AlertName, AlertDescription, RaisedDateTime
 FROM  Alert.vAlert
 WHERE AlertName LIKE '%' + @AlertName + '%'
 ORDER BY RaisedDateTime DESC
@AlertName will be used as a report parameter, which will be specified by the operator. You can test your query with the parameters by first declaring them in TSQL.
 DECLARE @AlertName varchar(max)
 SET @AlertName = 'some string to match'
Plug query into BI tool
Open the BI development studio and create a new report server project wizard.
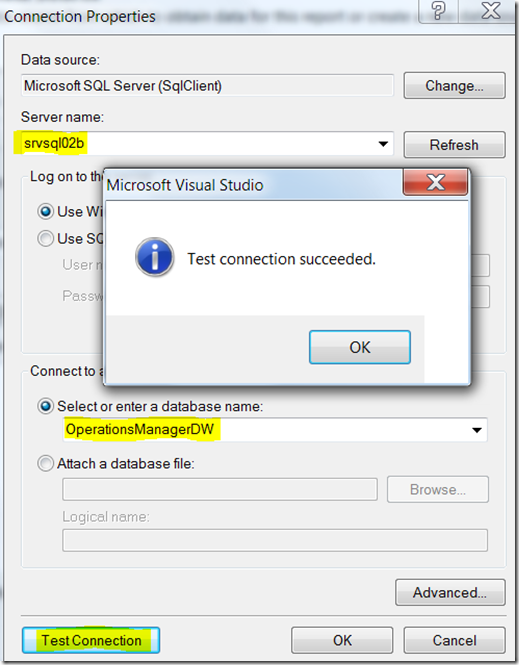
Create a new data source and click edit to setup the connection to the Data Warehouse. Doesn’t matter at this point what the data source name is.
Enter your connection details for the Data Warehouse and test the connection.
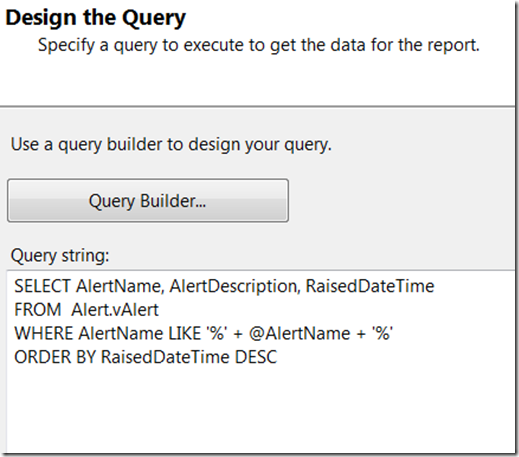
Paste the query you created in SQL Management Studio into the query builder.
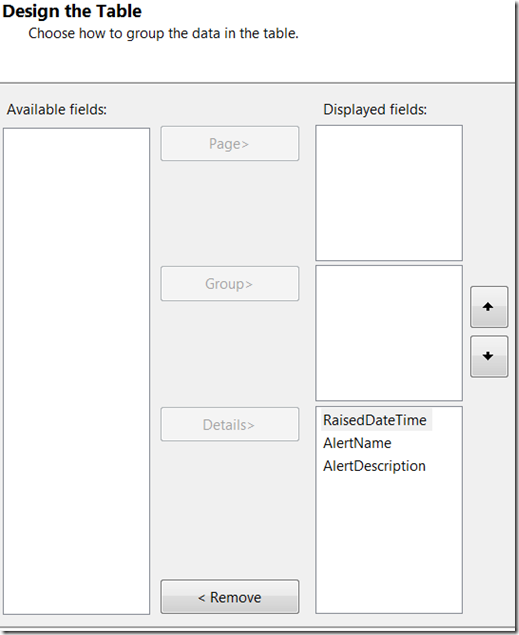
Add all the fields to the details pane.
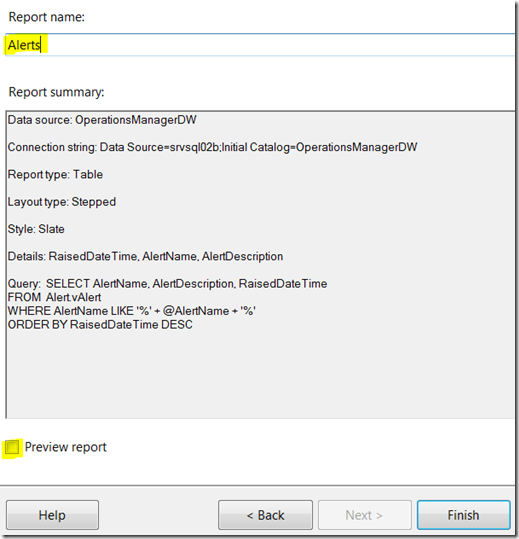
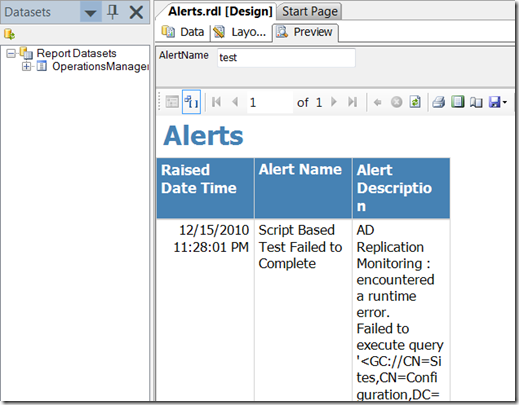
At this point, you can give it a meaningful name and click finish to preview the report.
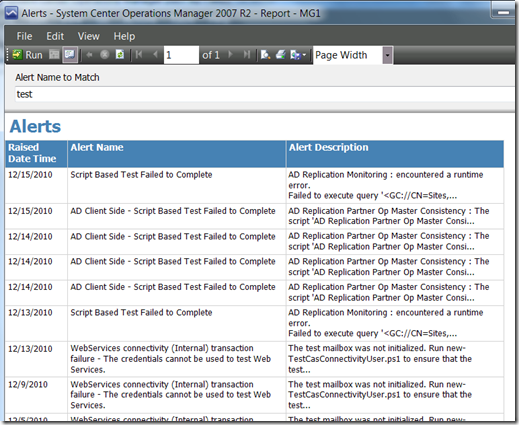
Enter a string for alert name to match in the parameter field and run the report.
Creating parameters for operator input
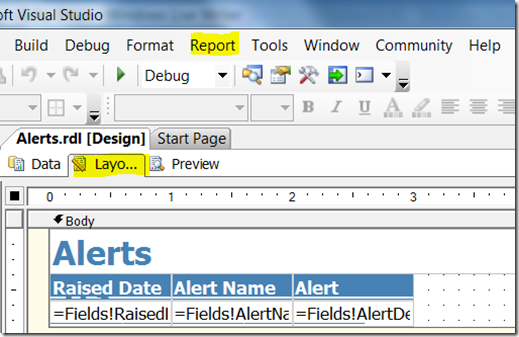
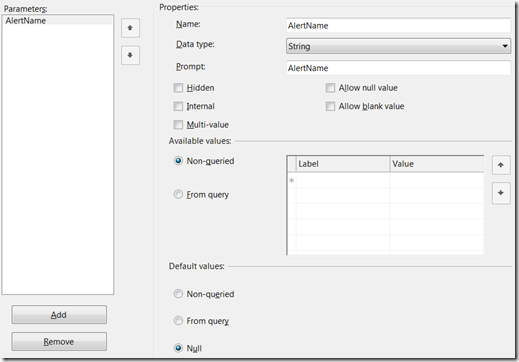
In this case, the parameters were automatically configured by the BI tool, but sometimes we might want to change or add parameters. To do this, click on the Layout tab and then click Report > Report Parameters.
You’ll see the parameter names on the left, and configuration elements for the selected parameter on the right.
For our AlertName parameter, all that is needed is the data type and prompt. Here we can modify the prompt, which is what is displayed to the operator in the UI.
Format the report
Back on the Layout tab, we can format elements in the report. Add colors, stretch columns, manipulate data, and many other capabilities are offered here. Here I will stretch the fields, change the date-time field to just date, and put a 100 character limit on the description field.
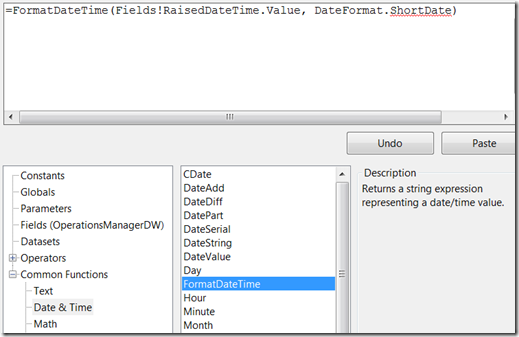
Right-click the RaisedDateTime field and select Expression from the fly-out menu. Update the expression to display just date in the report.
=FormatDateTime(Fields!RaisedDateTime.Value, DateFormat.ShortDate)
Right-click the AlertDescription field and select Expression from the fly-out menu. Update the expression to display only the first 100 characters of the description field. This helps reduce report size significantly, since some descriptions can be quite lengthy.
=iif (Len(Fields!AlertDescription.Value) > 100, Left(Fields!AlertDescription.Value, 97) & "...", Fields!AlertDescription.Value)
Lastly, adjust the size of the fields and preview the finished report.
Modify the data source
Now we’re ready to plug this code into a management pack. But first we’ll copy it out to notepad so we can update the data source. This is necessary for successful report deployment.
Click on View in the menu and select Code. Copy everything, except the first line.
Do not copy this part: <?xml version="1.0" encoding="utf-8"?>
Paste into notepad.
Replace the DataSources tag in the beginning of the XML with this:
 <DataSources>
   <DataSource Name="DataWarehouseMain">
     <DataSourceReference>Data Warehouse Main</DataSourceReference>
     <rd:DataSourceID>e4235c51-407f-4065-8519-a1e57374bc45</rd:DataSourceID>
   </DataSource>
 </DataSources>
Also replace this:
<DataSourceName>OperationsManagerDW</DataSourceName>
with this:
<DataSourceName>DataWarehouseMain</DataSourceName>
Now copy the contents from notepad. We’ll paste it into the report definition in the management pack in a minute.
Plug the report into a management pack
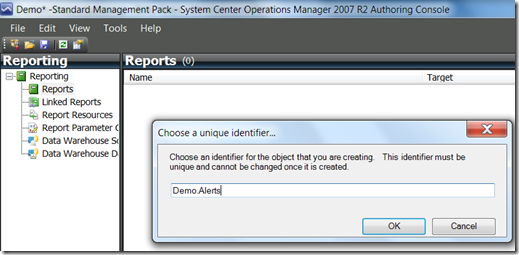
Open the Authoring Console and create a new management pack (or open an existing management pack). Navigate to the Reporting space and create a new report.
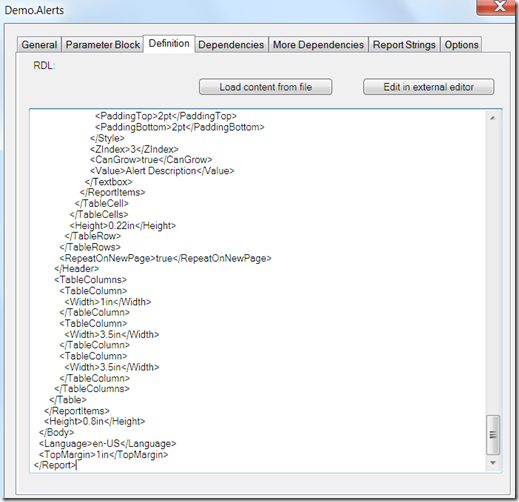
Click on the Definition tab and paste the contents you copied earlier from notepad.
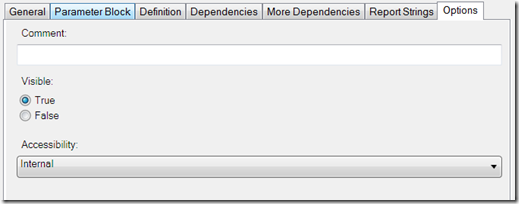
You’ll also need to set the visibility flag to True, otherwise the report will never show up.
Don’t forget to name the report in the General tab.
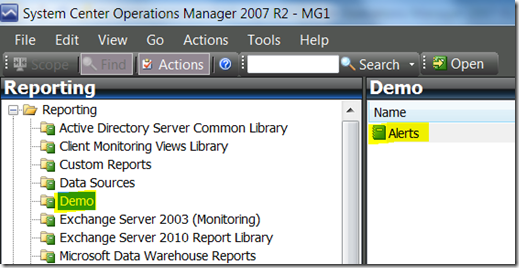
Save the management pack and import into your management group. After report deployment has executed on the RMS, you should see your new report in the Operations Console Reporting space.
So there you have it. Everything you need to start authoring custom reports. Although the report we created here is very basic and looks dull, once you start playing around with SRS you’ll find that it’s a powerful reporting engine. We can do things in report runtime that can make them much more flexible and a lot more fun to look at!


