Collecting Agent Performance Counters
Let's say you have an agent Health Service that has been restarting for some reason. One thing you can do to help identify Health Service restart trends is to collect and examine some relevant local agent performance counters. In particular, this will not pinpoint root cause. But it's a good place to start, and I thought I would blog about something fun and easy!
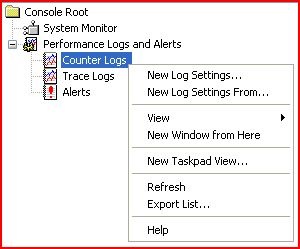
On the agent computer, open Performance Monitor. Right-click Counter Logs, click New Log Settings.
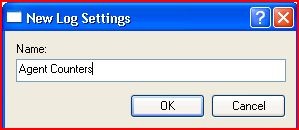
Type in a name for the new log.
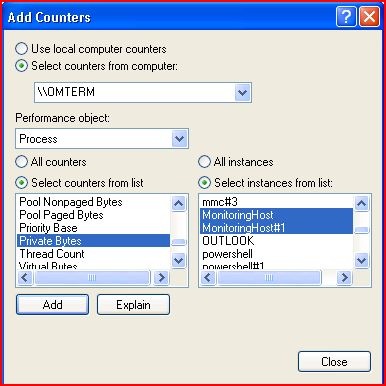
Click Add Counters. Under Performance object, select Process from the drop-down list. In Select counters from list, select Private Bytes. In Select instances from list, select HealthService. Click Add.

Also select any MonitoringHost instance in the list. You can make multiple selections by holding control key. Click Add, then close.
Under the General tab, you should see your added counters. Just keep the defaults here, and note the location of the Current log file name.
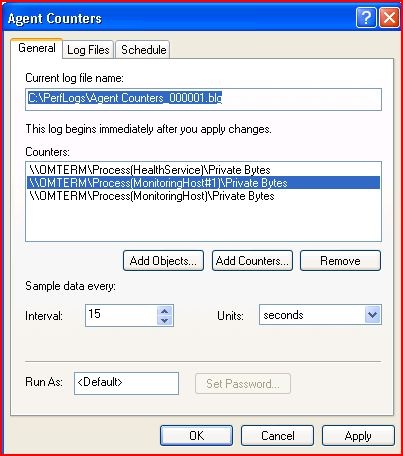
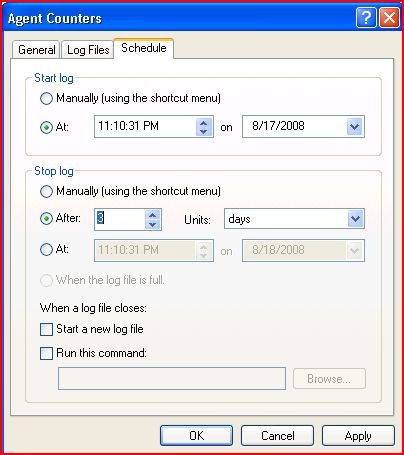
Click on Schedule tab. One setting here that may need to be adjusted, is the Stop log setting. Depending on how often the HealthService is restarting, you should adjust this accordingly so that you'll have enough data to trend the Private Bytes counters.
That's it. Click OK, and your new counter log should appear with a green icon (indicating that it's running).

Let it run for the allotted time, then open it to view the data. Here's how.
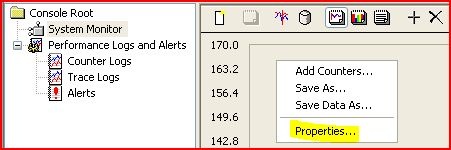
In Performance Monitor, select System Monitor in left pane. Right-click in the graph pane, and click Properties.
On the Source tab, click Log files. Click Add button and locate your counter log.
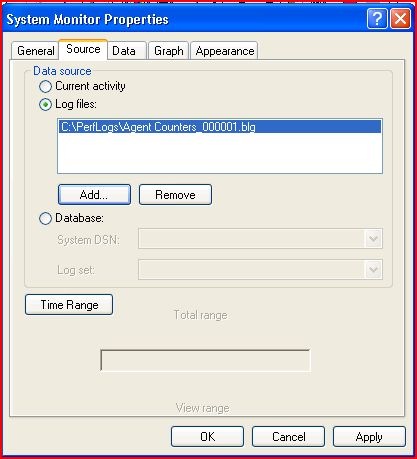
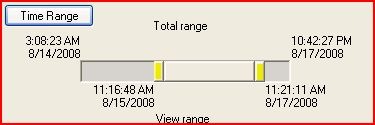
Notice the Time Range area. If these counters were collecting for days, you might want to zoom in on a specific day/hour to view a more detailed graph of the counters. You can move the viewable timeframe by clicking on either side of the bar (highlighted yellow) and moving to desired range.
Click the Data tab and add the counters you collected to the list. Remove other counters.

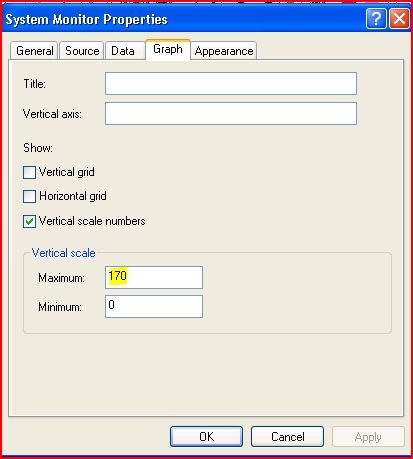
On the Graph tab, you may need to adjust the minimum/maximum values. If a counter is off the chart, come back to the graph tab and adjust the maximum value up until you can see all data.
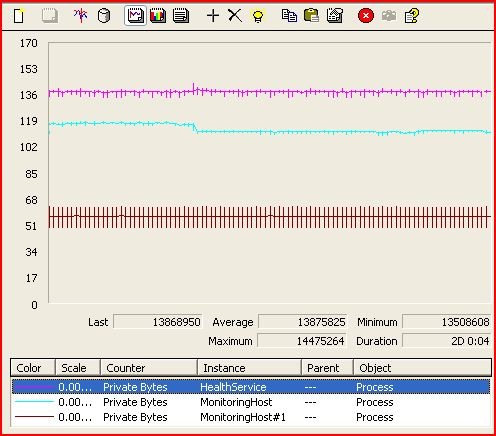
Results of my collection. This looks healthy. An unhealthy agent, or one that continues to reach restart thresholds, may show high/low spikes.