Unhealthy Monitors Report
I recently put together an “Unhealthy Monitors” report for an OpsMgr Administrator to see which Monitors are causing the most state degradation in the environment. This report lists all monitors that have objects in an unhealthy state, so we can see which monitors have the most unhealthy objects. Each monitor can be expanded to see which objects are unhealthy.
This does not show us which Monitors are generating the most State Changes, just which ones have the most objects which are currently unhealthy. The Monitors at the top of the list would generally need to be tuned (reconfigure thresholds, etc.) or disabled (Administrator is not concerned with the issue), or a systemic problem in the environment needs to be fixed.
NOTE: This report uses the Operations Database instead of the Data Warehouse….in order for it to work, you must create an SRS Data Source for the OpsDB…Kevin Holman has instructions for this here .
The report doesn’t take any parameters…just import into SRS and run it.
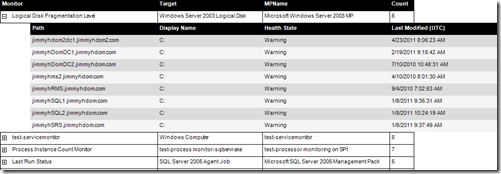
The output will show the Monitor name, Target class, Management Pack name, and the number of objects that are not in a healthy state:
Each Monitor in the list is expandable to show a list of objects that are in an unhealthy state…the list shows the Path, Display Name, Health State, and Last Modified time (when it last changed to an unhealthy state):
The table format of the report makes it very easy to export to Excel, where you can do filtering and sorting:


