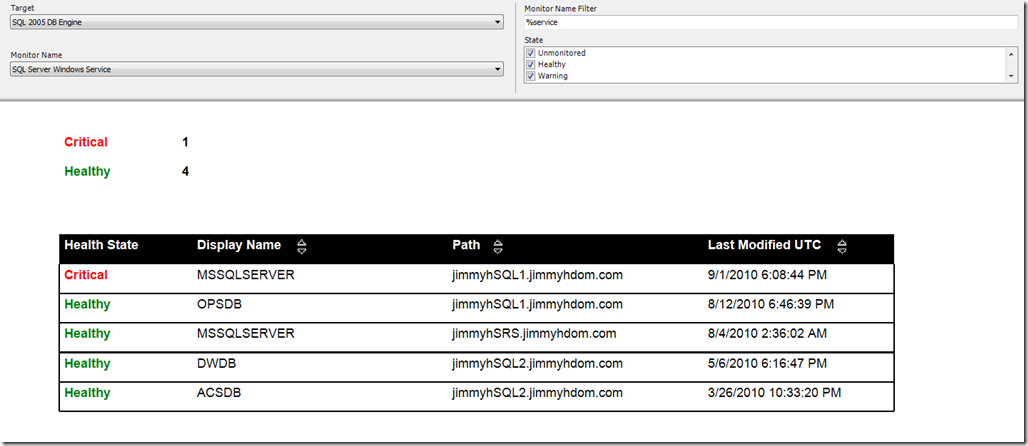
Monitor State Report
OpsMgr Health Explorer allows you to look at the State of all Monitors for a specific object. But, what if you want to look at the State of a specific Monitor on ALL objects that it applies to? For example, I want to see the state of the “SQL Server Windows Service” Monitor on all objects that it applies to….or maybe just those that are in a Critical State….or maybe just for the version of the monitor that is targeted at the SQL 2005 DB Engine class. Here is a report that should help with this.
The report allows you to select a Monitor and view the state of all objects targeted by the monitor. It requires a data source for the Operations database (the data source should be named “OpsDB”. Kevin Holman has instructions on how to create this here.
The report has four parameters to select:
Target
Selecting a Target Class will narrow down the list of monitors to choose from. If you know what class the monitor you are interested in targets, select it here. Otherwise, use the default of <ALL>
Monitor Name Filter
If you know part of the name of the monitor you are interested in, enter it here to narrow down the list of monitors. Otherwise, use the default of “%”
Monitor Name
This will give a list of monitors to choose from, based on selection in the Target and Monitor Name Filter Parameters. This uses the Display Name property of the monitors, and there could be more than one monitor with the same display name. For example, the SQL MP has a “SQL Server Windows Service” monitor targeted at both SQL 2005 DB Engine and SQL 2008 DB Engine. If the Target parameter is set to "<ALL>”, we will show the state of both monitors. If you need to narrow it down, select the desired target.
State
Select the state(s) that you want to show in the report (Unmonitored, Healthy, Warning, Critical)
Right now, the report is pretty basic in what it displays…I’m open to feedback and suggestions for improvement.
