Sample Queries and Reports from my MMS Session
Here are the reports and queries that I used in the demos of my “Writing Basic Custom Reports for Operations Manager” session at MMS 2010.
**I’ve updated the Alert Dashboard report to correct a problem with the Alert Priority/Severity pie charts.
Here are the descriptions of each file included:
MMS.Sample.Reports.MP.xml
This is the Management Pack that contains all of the reports listed below.
Sample Reports:
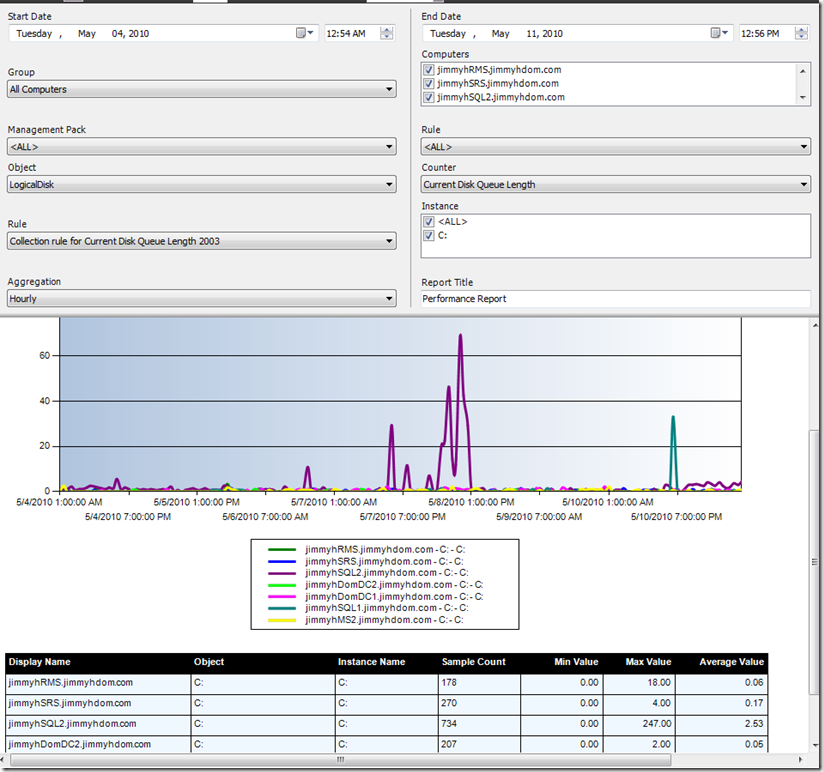
Advanced.Performance.Report.rdl
This report allows the user to select a singe Performance Counter to report on. The user can find the counter based on Management Pack, Rule, Object, Counter, and Instance. The user can also select the computers to report on, based on group membership.
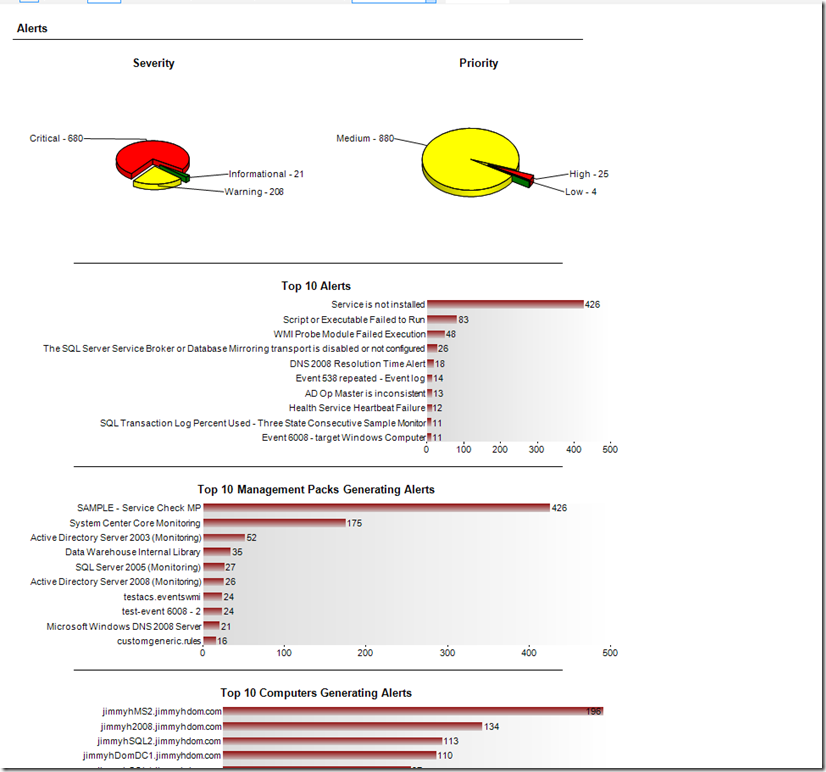
Alert.Dashboard.rdl
This report shows the following information about Alerts within a user-specified time range:
- Pie charts showing alert count by Severity and Priority
- Line charts showing Top 10 Alerts, Top 10 Management Packs generating alerts, and Top 10 Computers generating alerts
- Pie/Line charts showing Alert logging latency
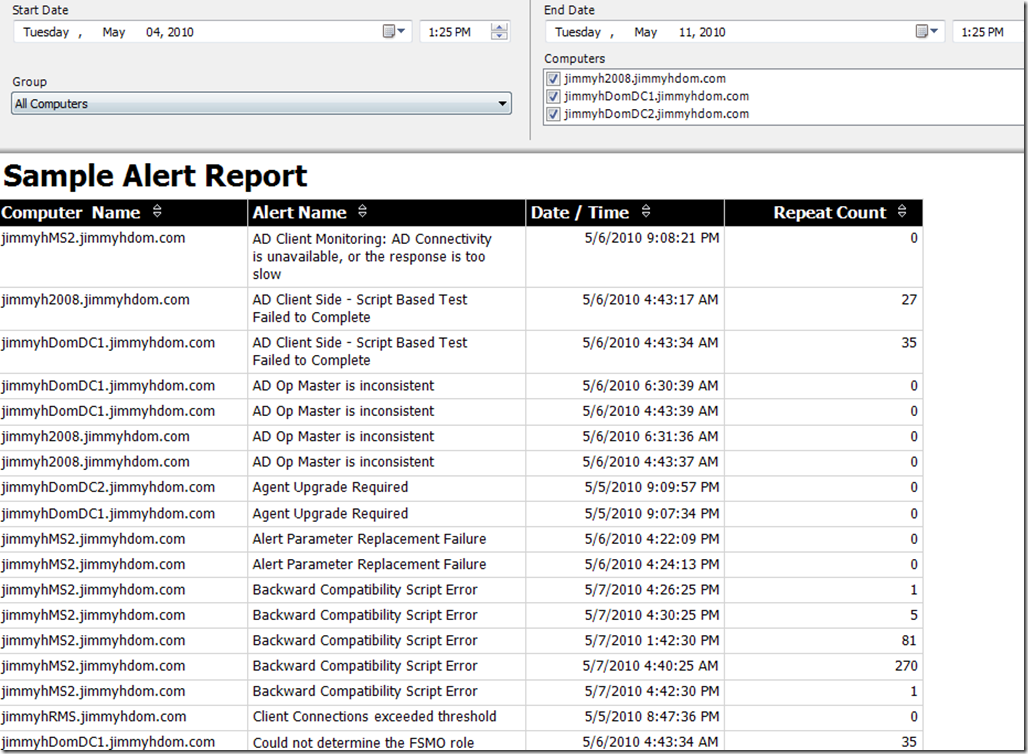
Sample.Alert.Report.rdl
This report displays a basic table with Computer Name, Alert Name, Date/Time, and Repeat Count. The user selects a date range and the computers to report on, based on group membership
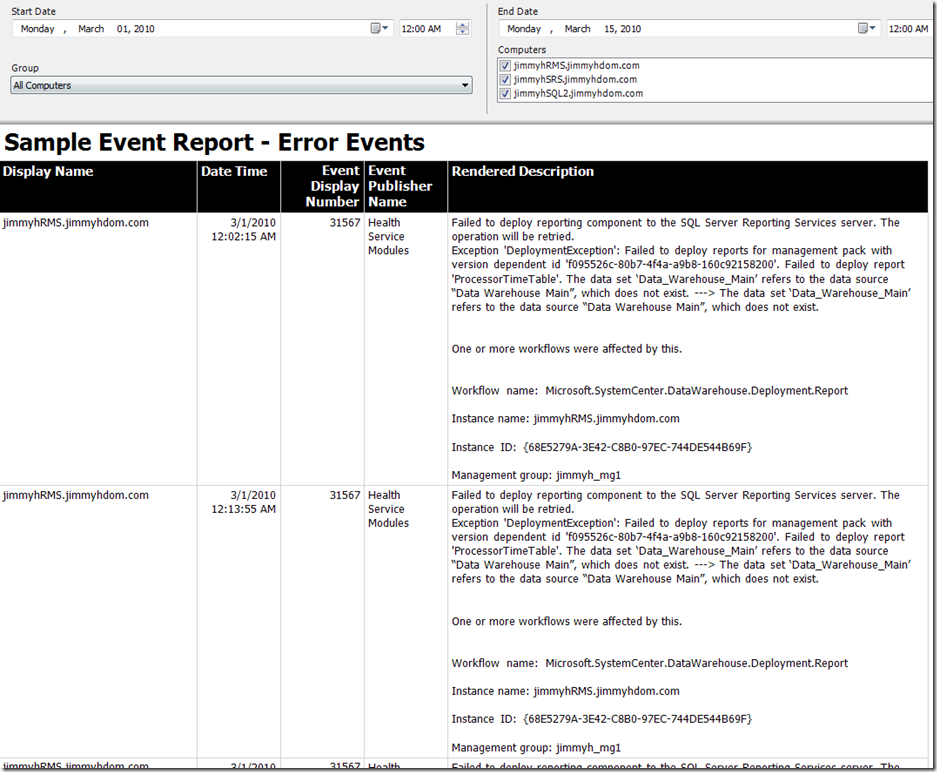
Sample.Event.Report.BasicTable.rdl
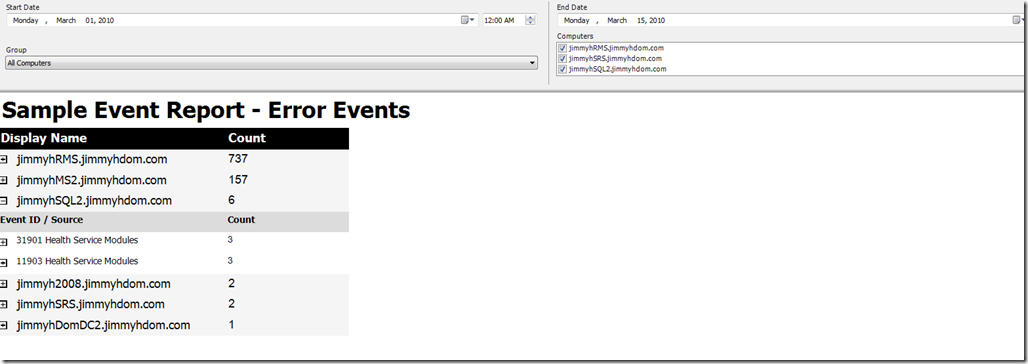
This report displays a table showing error events for specified computers. The user selects a date range and the computers to report on, based on group membership
Sample.Event.Report.GroupedTable.rdl
Same data as the above report, but this one groups by Computer Name and Event ID/Source to make the report cleaner.
Sample.Performance.Report.Chart.rdl
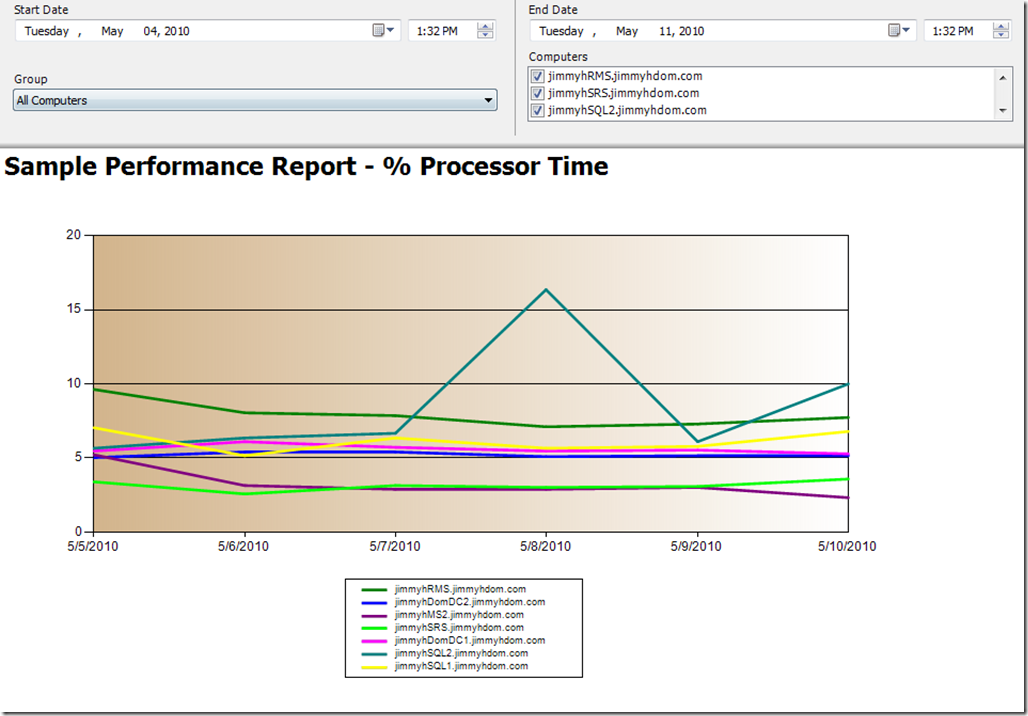
This report shows a line chart of the %Processor Time counter for selected Computers.
Sample.Performance.Report.Table.rdl
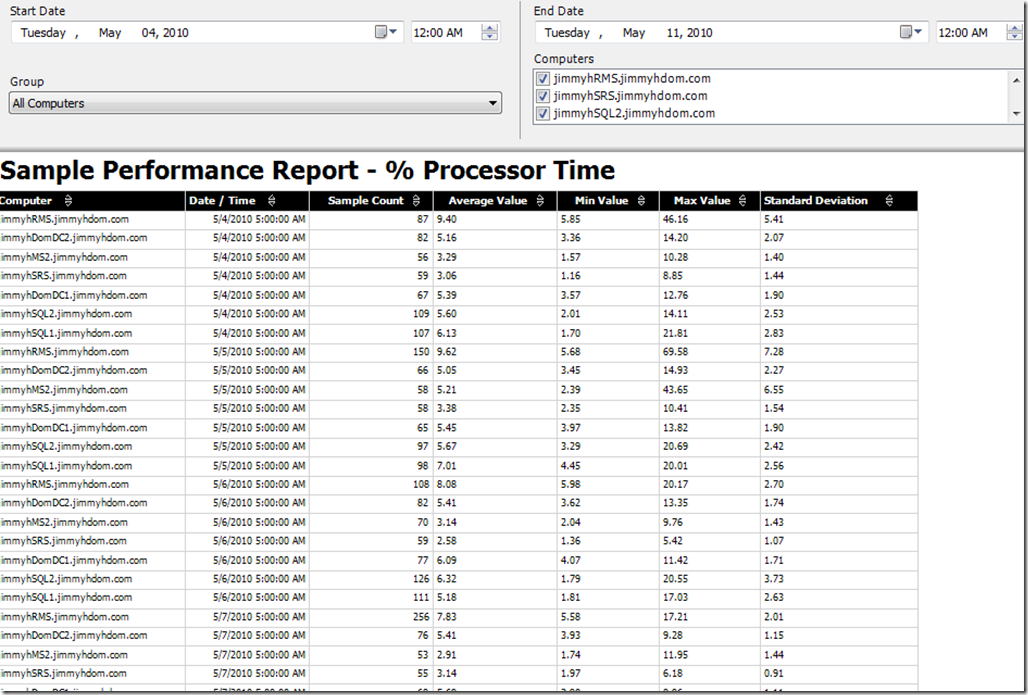
Same as above, but the data is in a table instead of a chart.
Sample Queries
GroupList.txt
This query gets a list of groups currently in OpsMgr. It will only return groups that contain objects (empty groups are not listed)
ComputerList.txt
This query gets a list of objects in a group, then returns the Computer Name for each object. The query requires the ManagedEntityRowId for the group as a parameter (passed by the above GroupList query).
AlertReport1.txt
This is the basic query used for the Sample Alert Report, but does not contain any parameters…it just gets data for ALL alerts
AlertReport.txt
This is the query used for the Sample Alert Report, with Computer and Date Range parameters
EventReport.txt
This is the query used in the above Event Reports.
PerfReport.txt
This is the query used in the above Performance Reports
Thanks to everyone who came to my session.
