Guest Post: Troubleshooting Network Security Groups!
The following article comes from Karina Galea, a senior engineer at Dimension Data. It focuses on troubleshooting Networking Security Groups in Microsoft Azure. If you need more information on this topic please check out this information in our documentation online. If you want more information about Azure Resource Manager and templates then check out this link as well.
Troubleshooting Network Security Groups
Are you using NSGs in the Azure Resource Manager Model and want to troubleshoot why something isn’t working? ARM now offers diagnostics on NSGs but at first glance this appears rather difficult to get to and understand the data.
The manual steps to get to these logs would be follows:
- Find the VM, identify the NSG, and view the diagnostics on the NSG to locate the storage account.
- From the storage account, drill down through the 14 levels of folders inside the container to find the log file relevant to the date and time you are after.
- Get the path to the file then use a GUI or command line tool to download the file from Azure storage (including more clicks through the console to get the storage keys).
- Open the 15MB file in a json parser and try to make sense of the data.
- At this point you will need to go back to the VM to determine the MAC Address to filter the data based on that, and then enumerate which rules and time that you were interested in.
- Then you realize that the matchedconnection counter looks rather big, and as you discover this is incremental you need to look back to the last value to see the changes for that period.
If you get through all of those steps, well done, but the likelihood that you will do them again manually is low.
So... PowerShell to the rescue. Initially some of the above steps seem rather difficult with PowerShell, but I will walk you through the challenges to make a nice clean script that you can use to easily get the usage data on your Azure NSG rules. This data will give you a view of how much traffic you are getting allowed or blocked on a per rule basis per VM.
A few variables we need to know to start:
$ServerName = "kgtestvm"
$NSGName="kgtestvm"
$NSGResourceGroup="KG_Resource"
$ServerName is the name of your VM
$NSGName is the name of the NSG attached to that VM (either at the VM level or the subnet level)
$NSGResourceGroup is the name of the resource group where that VM resides
Next step is to login to Azure.
Login-AzureRmAccount
Now we will go and get the network interface and NSG objects.
$NSG = Get-AzureRmNetworkSecurityGroup -Name $NSGName -ResourceGroupName $NSGResourceGroup
$NICs = Get-AzureRmNetworkInterface|?{($_.VirtualMachine.Id).split("/")[-1] -eq $ServerName}
$TargetMACs = $NICs|%{$_.MacAddress.Replace("-","")}
The NICs are needed to get the MacAddress which is needed to filter this log to this server only later in this script. I am using a bit of pipelining and powershell shortcuts to keep this short and sweet. Here is a bit of explanation:
- The “?” on the NICs line is a filter and the text inside the filter looks for the last element (-1) of the VM Id string linked to the NIC (split on “/”) that equals the name of the VM.
- The % is a foreach and the replace takes the dashes out of the MacAddress to match how it appears in the log.
Next we get the details for the storage diagnostic account where we need to get the log from:
$DiagSetting = Get-AzureRmDiagnosticSetting -ResourceId $NSG.Id
if ($DiagSetting -eq $null -or -not(($DiagSetting.Logs|?{$_.Category -eq "NetworkSecurityGroupRuleCounter"}).Enabled)) { throw "There is no diagnostic logging on the '$($NSGName)' NSG." }
$StorageResGrp = $DiagSetting.StorageAccountId.Split("/")[4]
$StorageName = $DiagSetting.StorageAccountId.Split("/")[8]
$DiagStorageKey = Get-AzureRmStorageAccountKey -ResourceGroupName $StorageResGrp -Name $StorageName
Two things to note in that code:
- Check that there is a diagnostic setting and that the counter logs are enabled. Otherwise there are no logs to look at.
- The splits on the $DiagSetting get the relevant details out of an id string for the storage.
Go and get the latest blob:
$connectionString = "DefaultEndpointsProtocol=https;AccountName=$($StorageName);AccountKey=$($DiagStorageKey.Key1)"
[Microsoft.WindowsAzure.Storage.CloudStorageAccount]$storageAccount = [Microsoft.WindowsAzure.Storage.CloudStorageAccount]::Parse($connectionString)
[Microsoft.WindowsAzure.Storage.Blob.CloudBlobClient]$client = $storageAccount.CreateCloudBlobClient()
$container = $client.GetContainerReference("insights-logs-networksecuritygrouprulecounter")
$Blob = $container.ListBlobs($null,$true)|sort {$_.properties.LastModified}|select -Last 1
This is where I stop using Cmdlets and start using .NET. The reason for this is because the cmdlets do not allow me to get to a diagnostic log when the path is too long… as most diagnostic paths are because they include full id, all names and group names, and the year, month, day, hour.
E.g. resourceId=/SUBSCRIPTIONS/XXXXXXXX-YYYY-ZZZZ-AAAA-BBBBBBBBBBBB/RESOURCEGROUPS/KG_RESOURCE/PROVIDERS/MICROSOFT.NETWORK/NETWORKSECURITYGROUPS/KGTESTVM/y=2016/m=03/d=08/h=08/m=00/PT1H.json
- The above code gets the newest blob (sorted by date and last selected) and stores the blob object into $blob.
Now we can download it and parse it all in one magical line:
$Records = (convertfrom-json ($Blob.DownloadText([System.Text.Encoding]::ASCII))).records
The magic:
- Rather than saving the blob and then opening the file, this opens the blob straight into memory using the DownloadText and specifying ASCII encoding.
- Then it runs the easy Cmdlet of “convertfrom-json” to convert the file format into an array of hashtables that can be easily consumed by PowerShell.
Last.. let’s look at the data:
$Records|select @{L="DateTime";E={Get-Date -Date $_.time}},@{L="rulename";E={$_.properties.rulename.Split("/")[-1]}},@{L="matchedconnections";E={$_.properties.matchedconnections}},@{L="macAddress";E={$_.properties.macAddress}}|?{$TargetMACs -contains $_.MacAddress}
- A little bit complex to look at, but all it is doing is getting the relevant data out:In a select statement @{L=ColName;E={Expression}} does calculations on the fly and makes new properties of them. So:
- DateTime is the datetime conversion of the WMI date style string
- RuleName is a subsection of the rulename string hidden under properties
- Matchedconnections and macAddress are the strings hidden under properties
- Then I filter to the MAC addresses that were collected earlier. Given this is an array because a VM can have more than one NIC, I use contains instead of equals.
So we get out something that looks like this:
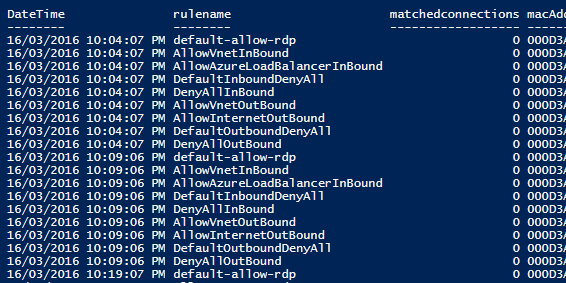
A breakdown of hits per rule given for all rules every 5 mins. When interpreting this please note the following:
- The matched connections are incremental and reset every hour. So 2 consecutive values of 5 mean no additional traffic in those 5 mins. A jump from 5 to 6 would
be one connection in those 5 mins.
What can we do with this? While there isn’t much data right now you will need to generate more rules to see a breakdown of connections. But this is a good building block for analyzing diagnosis data stored on Azure Blobs.. and I get the feeling that this data will be extended on over time. Given this script parses the Json, it will be easy to consume new changes.
Jeffa