An interesting journey with PowerShell, GPS data and SVG. (Part 2)
This is, I'm afraid, another of those "Wow! what can you do with a couple of long lines of PowerShell" posts.
I wanted to create a Scalable Vector Graphics (SVG) file for PowerGadgets' OUT-MAP cmdlet to do UK county maps. PowerGadgets, as I discovered is fussy about the SVG data it is passed, and I still have a bit more exploring to do on this: but an outline SVG file looks like this
 <?xml Version=1.0?>
<svg width="1200", height="1200", Viewbox="0,0,1200,1200">
<g>
   <g>
      <shape>
      <text>Label1</text>

   </g>
   <g>

    <g>
        <shape1>
        <shape2>
      </g>
      <text>Label2</text>
   </g>
</g>
</svg>
The G tags are Groups. So the the whole document is a group, and all it's subgroups are treated as map objects by PowerGadgets. These either contains one shape and text element - which PowerGadgets uses as its name - or a group of shapes and a text element. The SVG spec defines Rectangles, circles, Ellipses, Polygons and "paths", and I've only used paths with PowerGadgets so far. A Path looks like this.
<path d="M580,595 L574,590 L572,586 L576,590 L582,594 L580,595 Z" />
Everything is in the d parameter. Incidentally, be warned, a lot of this stuff is case sensitive. Inside the data says **M**ove to 580,595, **L**ine to574,590, **L**ine to 572,586, and the Z at the end says close the path Capital letters designate absolute co-ordinates and Lower Case ones are relative, all my data is in absolute form. PowerGadgets doesn't like very long paths, so I made a decision to round the data I got from Nearby.Org.UK. Fitting about 10.5 degrees of Latitude into 1200 pixels of screen says there's little point in dealing with anything after the second decimal place. I also made a decision to ditch points which were very close together. That way I could keep the PATH in the SVG file inside PowerGadgets' limit.
Now I'm pretty impressed with the whoever did the work to produce the data on that site (the blog there says it's a chap called Barry Hunter). Each county in Britain and Ireland has its own file. If a county includes Islands, each Island gets a file - this is perfect creating those Paths, each file is a path statement in the SVG file. There are 300 files. There is no way on earth I'm going to hand process that lot. I mean... I could load them into Excel, do the rounding, calculate the distance between each point and it's predecessor, isolate the points with a suitable gap and then - somehow - get that data into the SVG format, but 300 times must be automated. Guess which tool I chose ? Yep PowerShell.
I created a script called do-map and called it for each file . Do-map takes a filename as a parameter and is, essentially 2 (long) lines of PS. I added 3 little filters as much as anything to make the rest easier to read. So here is the beginning of do-map
param($filename)
 filter round2 {Param ($Number) [System.math]::round($number,2)}
filter sqr   {Param ($Number)  [System.math]::pow($number,2)}
filter cos    {Param ($Number);   [System.math]::cos($number * [system.math]::pi /180)}
(@("Lat,long") + (get-content $filename | where {$_ -notMatch '^#'})) > temp.csv
My 3 filters all call the .NET math library: Round2 rounds to 2 decimal places, SQR squares a number, and COS takes a number in degrees and returns the cosine (which I need to do get the projection right). So the first line of proper code, takes the text file from Nearby.Org.UK, strips it's initial comments and adds a header to make it a valid csv file. This goes into temp.CSV Next comes the longest line of PowerShell I have yet written, and bear in mind I've shortened it with those filters. To ease reading I've split it over 12 lines but it is really one line in the form Import-CSV | select-Object | where | foreach-object.
 (import-csv temp.csv  |
select-object @{NAME="Lat";   expression={round2 $_.lat}},
              @{NAME="Long";  expression={round2 $_.long}},
              @{Name="Delta"; expression={(sqr((round2 $_.lat)-$global:lastLat)) + (sqr((round2 $_.long)-$global:Lastlong));
                                          $global:LastLat=(Round2 $_.lat);
                                          $global:Lastlong=(round2 $_.long)}}
) | where {$_.delta -gt .0004 }|

 foreach-object -Begin   {[String] $MyXml='<g><path d="M'} `
                -Process {$myXml += 'L'+[string](885+100*$_.long) + ',' + [string][int](3500-30*$_.lat/(cos $_.lat)) + ' '} `
                -end     {$myXml.REPLACE('ML','M') + 'Z" /><text transform="matrix(1 0 0 1 ' +
                          [string] (885+100*$global:LastLong) +' ' + [string][int](3500-30*$global:Lastlat/(cos $global:Lastlat))+')">' +
                          ($filename.replace("C:\Users\jamesone\Counties\GBCountyBoundaryWGS84-","")).replace(".txt","")+'</text></g>'}
The import CSV is obvious, so lets look at the other bits. The select-object section has 3 calculated fields, Lat and Long are the result of rounding columns in the CSV file. Delta is doing a bit of Pythagoras on the latitude and longitude. I'm using a technique I've shown before: setting variables in the script block of a calculated field for select object to use outside the context of the current calculation; each row leaves its lat/long data for the next (The first row will get a big delta, which is fine) There's no need to work out the distance itself, testing the Square of the distance in the where to filter out any points with very small Deltas. I'm aware that if there are many points all very close together they will all be lost (instead of taking out some to leave a more widely spaced set). In practice this hasn't been a problem.
 Next we have a for in 3 parts.
-begin - create string $myXML with the start of the path statement.
-process - for each data point add LineTo its X,Y co-ordinates. These are scaled, and make this a Mercator project the Y co-ordinate is based on latitude/Cos(latitude)
[at Latitude Θ, 1 minute of Latitude is 1 Nautical mile, but 1 second of longitude is Cos Θ Nautical miles. If lines of longitude are drawn as parallel 1 unit apart then at latitude Θ the lines of latitude need to be drawn 1/cos Θ units apart]
- End: Return the XML, first change the first point in the path to be M - because it will be built as ML. Add the Close path "Z", and close the XML tag. Then add the label as a text tag, position it using the data left in LastLat and LastLong by the calculation of deltas. The actual text is extracted from the file name - I've been very lazy with this
So I invoke this script for each of the files -
dir C:\Users\jamesone\Counties\GB*.txt | %{C:\Users\jamesone\Do-Map.ps1 $_.fullName} > temp.xml
it took 7 minutes 20 seconds to do all 303 files. You can find this out with
Get-History | format table -auto CommandLine , StartExecutionTime, EndExecutionTime
(I'll leave a calculated field for run time as an Exercise for the reader). Temp.XML needs a small amount of cleaning up to become a usable SVG file - toping and tailing, then merging counties and their islands into a group and deleting islands with just one or two points, that's another 5-10 minutes. I test the file by opening it in Visio and assuming I haven't made any errors it looks fine so I can test it with out map, first to get a list of the object names, and then to use them to display a map
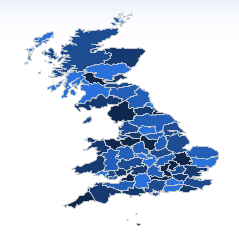
 out-map  -mapsource "custom maps\uk-counties" -ListObjects

Import-Csv countyData.csv | out-map -values value -Label county -mapsource "custom maps\uk-counties" -legendbox_visible false
You can see the result - click it to get a comparison with the non-Mercator projection. One final thing. The data that this was based on was shared under Creative Commons by-sa 2.5 and I've attached the map on the same basis. You can use it as you see fit, just acknowledge the work of Nearby.Org.Uk geting the data and mine/Microsoft's in formatting it for this use. If you create another data-set using this, the CC license as placed on the data I used says you have to share the data, but not any app which uses the data.
Technorati Tags: Powershell,SVG,GPS,Mapping,Mercator
Update, fixed a bunch of typos, bad edits etc.