On PowerGadgets
At the end of this week I fly off for a few days Scuba diving, and shortly after I get back I have a major PowerShell presentation to do. As usual with such things the struggle is what to include and what to leave out. Do I show some of the cool stuff that has been done around PowerShell by other people ? Since I can't include everyone the fairest thing would be not to talk about anyone. But would that be less interesting for the audience. So I've made a conscious effort to look at two tool sets. PowerGadgets and the PowerShell Community Extensions (which for the sake of a sensible post length I'll cover another time). On the plus side both of them provide some great features to what is already a great tool. On the negative side both of them suffer from poor documentation (which isn't PowerShell's strongest area either) and the tumble weed blowing through both their discussion areas gives the impression of something petering out without being finished.
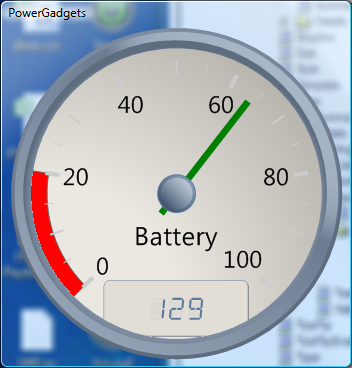
Power-gadgets positions itself as "Desktop Reporting and Monitoring for IT/DB professionals who don't write code" and that's not an unreasonable claim to make. It does Graphs, Maps and Gauges. I suspect it will be gauges that interest IT Pros monitoring systems - you can see the battery monitor which I put together with a command as simple as
GET-WMIObject win32_battery | Out-Gauge [Parameters]
Out-gauge is provided by PowerGadgets but it needs a command line which goes on forever.
-Type Radial
-Refresh 0:0:1
-Value estimatedChargeRemaining
-mainscale_max 100
-glass
-border_glare false
-mainindicator_color {if ($_.estimatedchargeRemaining -gt 40) {"green"} else {"red"} }
-palette professional
-Titles_0_Text "Battery"
-Titles_0_Layout_Target AnchorPoint
-Titles_0_Layout_AnchorPoint "0, -0.3"
-mainScale_stripes_0_max 20
-mainScale_stripes_0_radius 1.2
-mainScale_stripes_0_color RED
-innerGauges_add digital
-innerGauges_0_layout_alignment bottomCenter
-innerGauges_0_size 1,0.4
-innerGauges_0_digitalPanel_border_glare false
-innerGauges_0_digitalPanel_value {$_.EstimatedRunTime}
- Type specifies which of 4 gauge types I want, and -Refresh means it will get updated 0:1:0 means every 0hours, 1 Minute, 0 Seconds. -Value links to the the property of the WMI object. The last thing to do for a useful battery gauge is to set the scale.If this were VB script we'd have lines which did things like MainScale.max=100, but here the "sub-objects" which make up are set with parameters like MainScale_Max , Titles(0).Text etc .
With the basics in place I can get the look I want. - glass turns on the glass effect in vista (it looks quite good here, but I prefer the -floating parameter which lets the gauge float without a Window) -border_glare controls the effect of a light shining on the gauge - very smart but harder to read when the gauge is small. For added ease of reading, I wanted to change the needle colour to show when the battery was getting low, so that was - mainIndicator_color . I didn't like default colour scheme, but rather annoyingly Tab expansion fails to bring up the - Palette parameter - the first of several rough edges. Rough edge number 2 was the Parameter "Caption" doesn't set the title as it is supposed to , it's stuck as "PowerGadgets". So the -title parameters let me put text in the middle of gauge. Trawling through the help I stumbled on the stripe feature, so I added that with -mainscale_stripes, there is probably some sense to a radius of 1.0 being on the tick marks and not on the outside edge of the gauge, but it was one of several things I had to find by trial and error. Finally the -innerGauges parameters let me add a little digital readout for minutes of time left instead of %full, don't ask me why its value needs to be a code block when the one for the main indicator doesn't... I don't know and the "help" - isn't much help.
This kind of thing seems to be the sweet spot the "Digital Panel" gauge (I found wasn't flexible enough for things like displaying my IP configuration); but inner Gauges were the root cause for two more rough edges. First: you can add PowerGadgets to your Vista SideBar: what goes in is a place holder with a name like "Gadget 1" , you add -SideBar Gadget1 to the command line and Whoosh! the gauge goes on the sidebar. This has a major wow factor. Unfortunately my gadget crashes sidebar if I click on it (it works if I take the inner gauge out). Secondly there is a GUI PowerGadgets Creator and it comes up with a variety of errors when I try to stuff with inner gauges. The GUI editor has no help of its own, and I never worked out how to bind data values in it. The editor can output gadgets as a file and they can be started on the desktop or side bar, but no way is provided to get them back as a command line (the files are XML format, so some hacking can extract the information, and no doubt some clever soul could write a PowerShell function to do it) similarly there is no way to get a gadget on the desktop into the editor or back to PowerShell - though it is possible to specify a -Configure switch in PowerShell to edit the gadget into the editor.
I tried the Out-map feature, and needless to say the first thing I wanted was to create a custom map of my own. PowerGadgets maps use SVG format - a way of writing Scalable Vector Graphics in XML. Visio can save as SVG, so this offers the hope of having PowerGadgets light up your network plan depending on the state of machines on it. Sadly it is incredibly picky about what's in the XML file (which suggests a poor XML parser) and gets thrown by the smallest thing. I found I could hand craft SVG files, but when I made an error in one PowerGadgets crashed and took PowerShell with it. So of the three gadget types Maps looks the least complete.
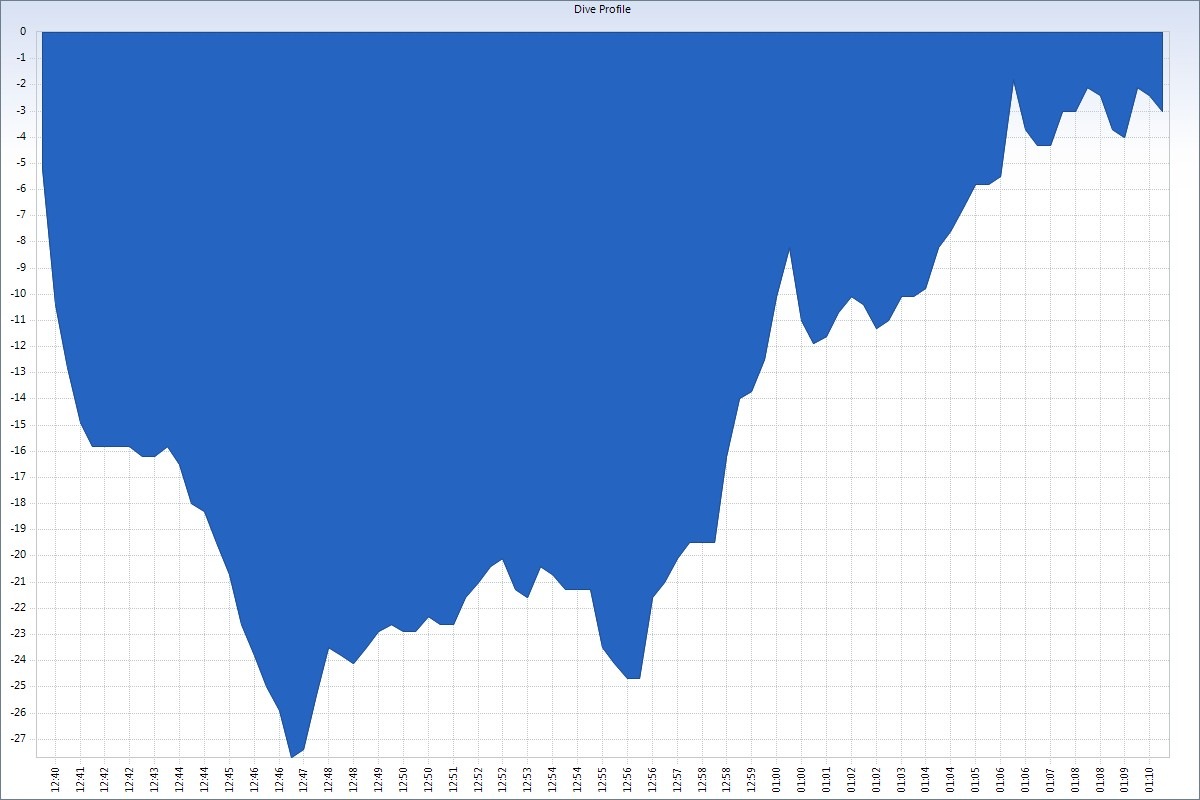
By contrast charts are quickest and easiest to use, of the three types in earlier post I was importing dive profiles and I can reproduce the charts my dive software creates with one, by selecting one dive and piping it into relatively simple Out-Chart
Out-Chart -Values {-1 * $_.segmentDepth} -Gallery 3 -label {$_.dateTime.toString("hh:mm")} -legendBox_visible false
 All three gadget types support an output switch so you can save the gadget as .BMP .PNG or WMF file (though oddly not as a JPG), and they offer the opportunity to "drill down" into a selected data item; so if a chart or a map region has underlying data you can do something interesting with it (a demo on the PowerGadgets site shows charting the handles used by Processes, and killing a process by clicking its column in the chart), the "drill down command" isn't required to take data so a CPU gauge could open Task Manager.
Although I didn't start out to write a review of PowerGadgets that's what this has become, so what conclusions would I draw ? The silence that has fallen over the forums part of the PowerGadgets Web site worries me: because this is a product with great potential which deserves to succeed: but potential isn't enough and I can't see it getting to required level of quality without a decent base of early adopters. Would I recommend people to adopt it or avoid it ? Neither: it offers great functionality, but it doesn't serve it up on a plate for you, which can be frustrating. People working with PowerShell should try PowerGadgets for themselves and decide if the functionality to frustration ratio is good enough to justify buying it.
Technorati Tags: Microsoft,Windows Server 2008,Vista,Powershell,PowerGadgets