
Use the PowerShell Debugger to Troubleshoot Scripts
Summary: Learn how to use the Windows PowerShell script debugger to troubleshoot problems with scripts.
Microsoft Scripting Guy Ed Wilson here. One of the fun things about traveling, especially to warm places when it is winter back home, is calling to talk to friends and relatives. When they say things like, “It snowed yesterday,” I grimace a little and reluctantly tell them it was 70 degrees Fahrenheit (21 degrees Celsius according to my unit conversion module) in sunny Southern California. But the best thing is getting to work with customers and talking to people about Windows PowerShell.
Invariably, when I am talking to people about writing Windows PowerShell scripts, someone comes up with the question about script debugging. To be honest, I rarely fire up a debugger. Never have, even back in the VBScript days. I generally write code in such a way that when a problem occurs, it is obvious where the problem lies and how to correct it. Every once in a while, however, the problem is not obvious, and being able to actually debug the script comes in helpful.
In Windows PowerShell 2.0, we introduced several Windows PowerShell cmdlets that make it easier to debug scripts. Today, I want to spend a little time looking at some of the things to do with one of the cmdlets.
Debugging a Windows PowerShell script often involves setting a breakpoint, which is something that causes the Windows PowerShell script to pause execution. When the script pauses execution, the Windows PowerShell console drops into debug mode. This special mode permits the use of certain commands. The commands appear in the table that follows (this table is copied from my Microsoft Press book, Windows PowerShell 2.0 Best Practices book).
|
Keyboard shortcut |
Command name |
Command meaning |
|
s |
Step-into |
Executes the next statement and then stops. |
|
v |
Step-over |
Executes the next statement, but skips functions and invocations. The skipped statements are executed, but not stepped through. |
|
o |
Step-out |
Steps out of the current function up one level, if nested. If in the main body, it continues to the end or the next breakpoint. The skipped statements are executed, but not stepped through. |
|
c |
Continue |
Continues to run until the script is complete or until the next breakpoint is reached. The skipped statements are executed, but not stepped through. |
|
l |
List |
Displays the part of the script that is executing. By default, it displays the current line, five previous lines, and 10 subsequent lines. To continue listing the script, press Enter. |
|
l <m> |
List |
Displays 16 lines of the script beginning with the line number specified by <m>. |
|
l <m> <n> |
List |
Displays <n> lines of the script, beginning with the line number specified by <m>. |
|
q |
Stop |
Stops executing the script, and exits the debugger. |
|
k |
Get-PsCallStack |
Displays the current call stack. |
|
<Enter> |
Repeat |
Repeats the last command if it was Step-into (s), Step-over (v), or List (l). Otherwise, represents a submit action. |
|
h or ? |
Help |
Displays the debugger command Help. |
There are several ways to configure breakpoints. For the next several examples, I am going to use the script that is shown here:
MyDebug.ps1
$cn = “localhost”
$process = “notepad”
Get-WmiObject -Class win32_bios -cn $cn
Start-Process $process
Get-Process $process
Keep in mind that the path to the script matters. I am going to set a breakpoint on a command on a script that appears in a specific location. If I run the script with the same name from a different location, the script will not break upon that command.
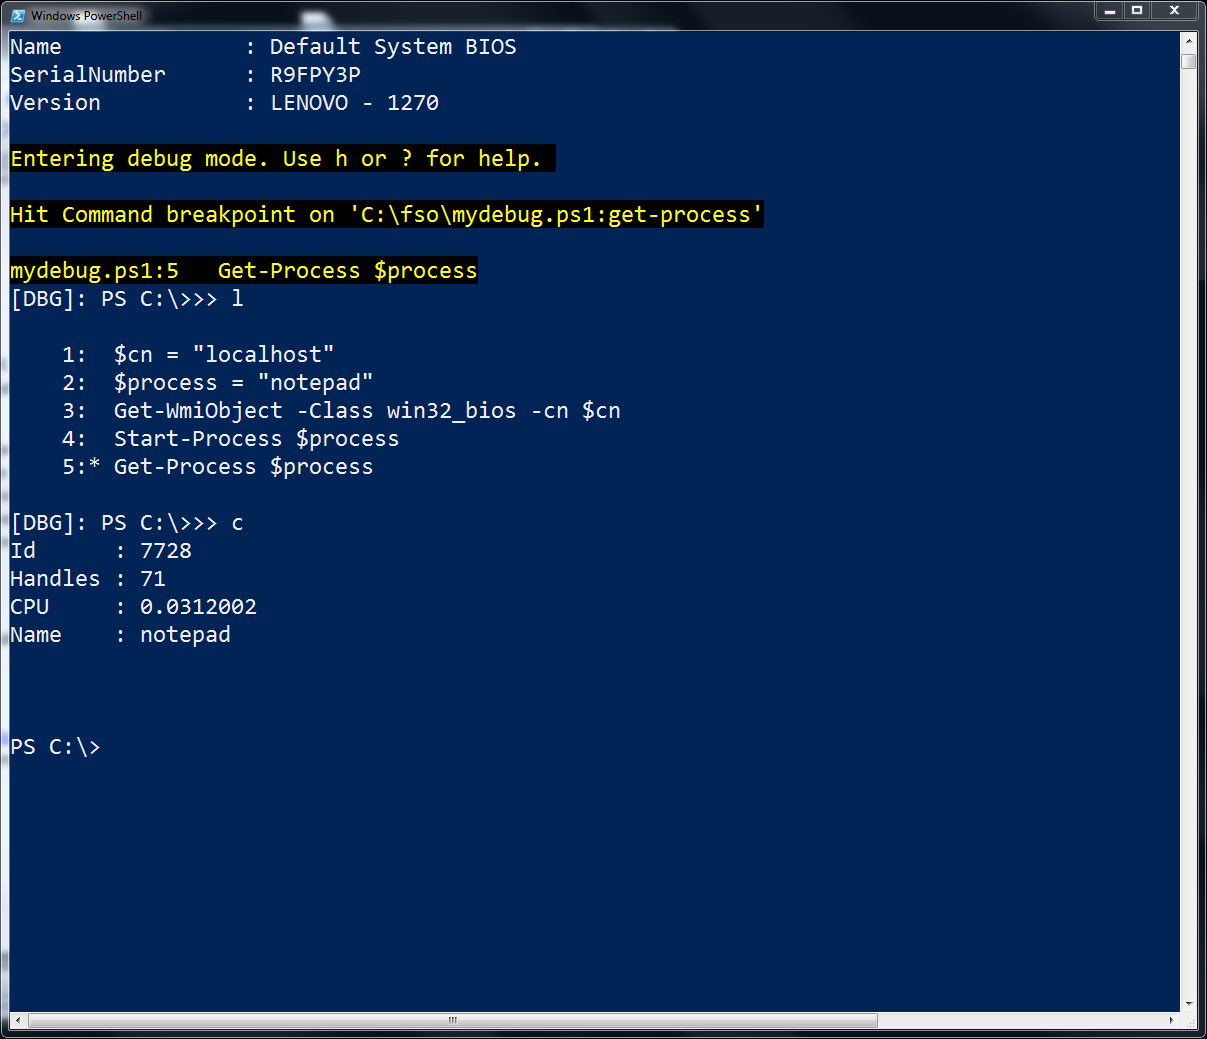
When the command Get-Process cmdlet appears, the script breaks and enters debug mode. In the code that follows, I use the Set-PSBreakpoint cmdlet to set the breakpoint on the Get-Process cmdlet for the script c:\fso\mydebug.ps1. The code and associated output are shown here:
PS C:\> Set-PSBreakpoint -Command get-process -Script C:\fso\mydebug.ps1
ID Script Line Command Variable
— —— —- ——- ——–
0 mydebug.ps1 get-process
Now, I execute the Windows PowerShell script. When the script hits the command Get-Process, it does not execute the command. Instead, it enters the debugger. I now have access to the commands listed in the table above.
I type the letter L to list the portion of the script that executes. By default, this displays the current line, five previous lines, and 10 subsequent lines. After examining the code, I decide to continue with script execution, and I press the letter C to continue running the script. In this example, it runs the Get-Process cmdlet, and ends the script, because the Get-Process cmdlet is the last line in the script. The setting of the breakpoint, launching of the script, using the L and the C commands in the debugger, and execution of the last line in the script are shown in the following figure.
I next decide to use the Set-PSBreakpoint cmdlet to set another breakpoint. This time, I break on a variable. The key thing to remember here is that when specifying a variable as a breakpoint, do not include the $ prefix; instead, use the variable name without the dollar sign. The command is shown here:
Set-PSBreakpoint -script c:\fso\mydebug.ps1 -Variable cn
When the script reaches the cn variable, it enters the debugger. I change the value assigned to the cn variable from “localhost” to “mred” and use the C command to continue execution of the script. After the script executes a couple lines of code, the script enters the second breakpoint—the breakpoint I first set on the Get-Process command. Once again, the script enters the debugger, and once again I use the C command to continue script execution. These commands and associated output are shown in the following figure.

Now, I decide to see how many breakpoints I have set. I use the Get-PSBreakpoint cmdlet:
Get-PSBreakpoint
The command and associated output are shown here:
PS C:\> Get-PSBreakpoint
ID Script Line Command Variable
— —— —- ——- ——–
0 mydebug.ps1 get-process
1 mydebug.ps1 cn
Now, I decide to get rid of all the breakpoints. To do this, I use the Get-PSBreakpoint cmdlet and pipe it to the Remove-PSBreakpoint cmdlet. Next, I use Get-PSBreakpoint to ensure I removed all the breakpoints. The commands and associated output are shown here:
PS C:\> Get-PSBreakpoint | Remove-PSBreakpoint
PS C:\> Get-PSBreakpoint
That is all there is to using a command to break into a script. Join me tomorrow when I will continue talking about debugging Windows PowerShell scripts.
I invite you to follow me on Twitter and Facebook. If you have any questions, send email to me at scripter@microsoft.com, or post your questions on the Official Scripting Guys Forum. See you tomorrow. Until then, peace.
Ed Wilson, Microsoft Scripting Guy
 Light
Light Dark
Dark
0 comments