Case of the Unexplained: Lost Client Connections
At TechEd Berlin I had the opportunity to present a VMM performance troubleshooting case study in Iftekhar Hussain's VIR311 session. You can hear the presentation https://bit.ly/aQ11bP starting at 50:10.
Symptoms Reported
On our production server, we observed that VMM server became very slow. On one of the clients the connection to the server was lost, and the attempt to create a new connection was also not successful. On inspecting the VMM server, the VMM service was taking around 2 GB of memory and was consuming ~25% CPU - which is much higher the usual range of ~500 MB. I collected the memory dump of the VMM service at that time and the logs of the last few minutes at the server. I restarted the service to make it usable. After the service restart, the memory foot-print was around 250 MB and the server was behaving normally again.
A few days back also, I had observed that a few calls like Get-VM (-all or –VMHost), Get-VMHostGroup (-all) were taking times in excess of 1 minute. After some time, the client lost the connection and after initiating the new connection – the things were back to normal. I could not collect logs or any other data at that point.
Troubleshooting Steps (raw log)
I RDP’d into the machine about 2 weeks ago and left the session open with Process Explorer and Process Monitor ready to run once the issue repro’d. Two days ago (7/13/2010), I finally noticed the high CPU utilization and sluggish performance. I first looked at TaskMgr
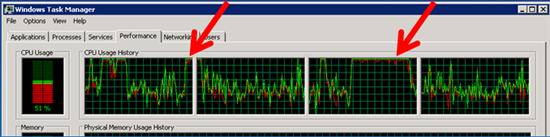
The system is still usable… but sluggish. This is what I see in Task Manager:
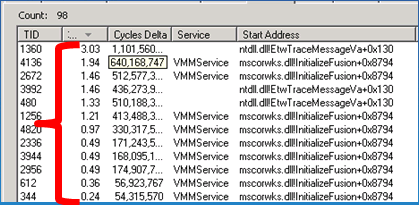
VMMService process is not very interesting… lots of this threads consuming 1-3% CPU:
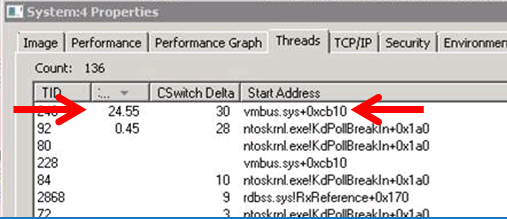
However, in the System process, the top CPU hog is VMBus:
I tried to get as much info as possible using xperf and TTTracer. I ended up killing the VMMService process accidently after detaching the tracer. This did result in a drop in CPU
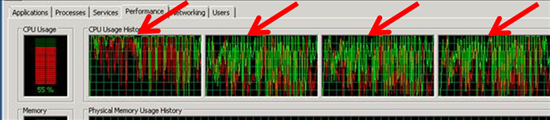
CPU utilization during repro:

CPU Utilization right after repro (VMM service restarting):

CPU Utilization after repro (system at “steady state”):

At this point I thought I had lost the repro… until yesterday (7/15/2010) when the symptoms returned.
Typically this issue takes 5-10 days to reproduce. Since this is a production system, the Visual Studio team who owns this machine simply reboot the guest OS. This time however, I was the one that simply restarted the VMMService. Now I got the repro in less than 24 hours.
So with the repro in hand I went off an collected Performance Monitor information. After playing around with loading and unloading counters for disk, network, processes… I narrowed down the list to a few heavy hitters.
- I/O Other Operations/Sec (Process: vmmservice.exe)
- I/O Other Bytes/sec (Process: vmmservice.exe)

“I/O Other” guided me down the path of looking at the network load on the box:
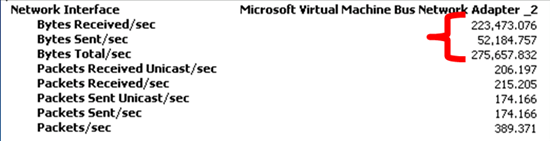
I kicked off Process Monitor and captured a few seconds of activity on the box. After reviewing the information I extracted the following summary for 60 seconds of activity:
All operations:
- Time range: 3:35 – 3:35 (1 min)
- All events: 26687
All operations (EXCLUDING vmmservice.exe):
- Time range: 3:35 – 3:35 (1 min)
- All events: 13179
- Network (TCP/UDP): 1778
ONLY operations for VMMservice.exe:
- Time range: 3:35 – 3:35 (1 min)
- All events: 13508
- Network (TCP/UDP): 10278 (171 TCP Send/Receive)
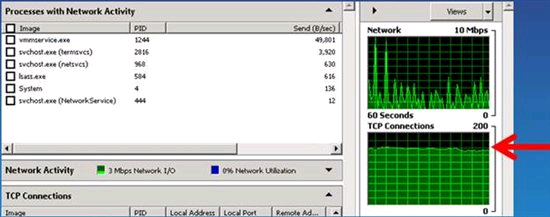
Looking at Resource Monitor, VMMService.exe has about ~160 TCP connections:
At this point I started searching online for similar symptoms and landed on https://support.microsoft.com/kb/981836. Network connectivity for a Windows Server 2003-based Hyper-Vvirtual machine is lost temporarily in Windows Server 2008 R2
However, this article specifically points to W2K3 guests. So I looked up the WINSE bug and it specifically states that this issue should not occur with W2K8 because the issue is specific to NDIS5.
Information reported to Hyper-V team on 07/22/2010:
· The following changes were made to the environment before 7/22/2010
o KB9881836 has been applied on the parent partition
o The updated integration services have been applied to the SCVMM VM. They are now: 6.1.7600.20683
o The reg key has been set on the parent partition & VM
§ “HKLM\System\CurrentControlSet\Control\Session Manager\Memory Management”, create a DWORD “DisablePagingExecutive” with value 1
§ The kernel debug switch has been set on the parent partition & VM. (bcdedit /debug on)
Logged into machine and opened TaskMgr.
Notice how “CPU usage” graph on the left is not properly reporting the % used.
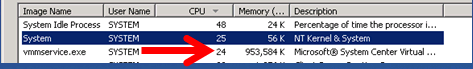
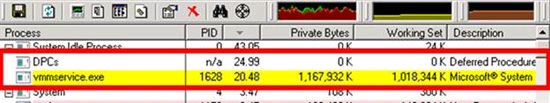
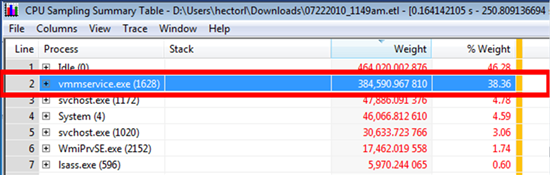
So I jump to Processes tab and notice that VMMSERVICE is consuming 30-50% of the CPU:

So I fire up Process Explorer to confirm this and notice that VMMSERVICE is one of the CPU hogs along with DPCs (device drivers use DPCs to complete I/O requests):
Considering that last time I observed high CPU was on VMBus.sys, I decided to collect xperf info
C:\>XPERF.EXE –on DIAGEASY
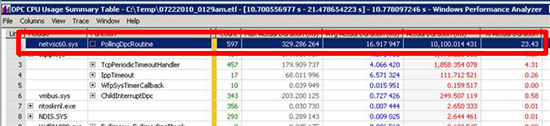
Focusing on DPC info only… I loaded CPU usage summary and noticed that NETVSC60.sys is consuming the most CPU.
Quick, search online tells me that each DPC should not be taking more than 100ms. I am not sure if this is a fact but if you look at the top entries with >100 ms… they are all network related
Also collected the following trace
C:\> xperf -on base -stackwalk profile
After walking the stack trace for 30 minutes
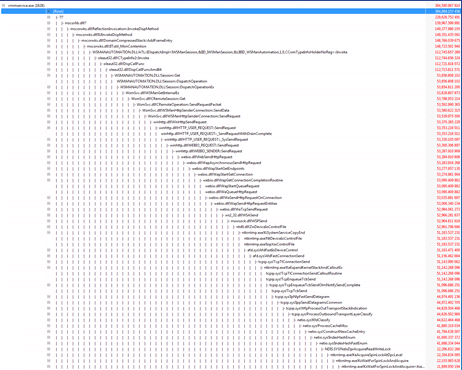
netio is consuming spinning on some spinlocks
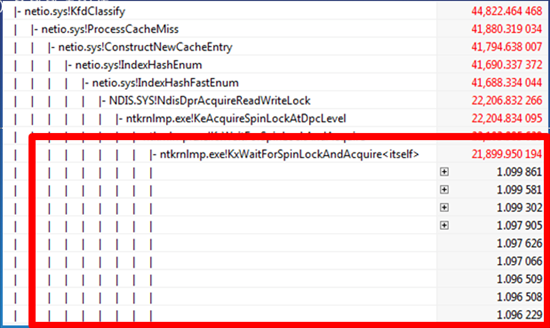
Turns out that this is due to WFP filters used by ForeFront
- · WFP filters causing cache invalidation
- · Forefront uses WFP filters for its network monitoring driver
- · Forefront team provided notified and they provided workaround
- · ForeFront is still Investigation this issue for a proper root cause and fix
Lesson Learned
- · Issue required ~4 minutes of traces to help isolate the culprit
- · However, the issue went unsolved for over 6 months
- · Supplement your system knowledge with Windows tools
- · Capture as much information in case you need to call PSS/CSS
- · Waiting for a performance issue to repro is risky
- · Minimize exposure by adding performance tools to your toolbox
- · Understand how to read a stack trace