Business Intelligence: From classic to self-service BI.
Hi Everyone!
This time I wanted to post an article about the new concepts of self-service BI and how Excel plays the lead role in it.
The classic way
First of all, let´s go to the basis about the "classic" BI solutions I was involved back some years ago. To summarize all the elements that are involved I have this simplified diagram:
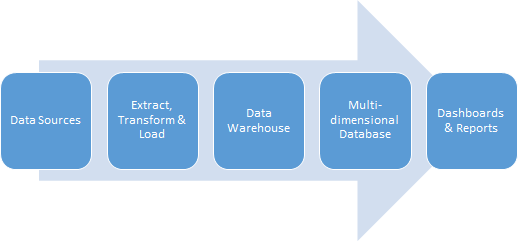
You have the following elements:
Data Sources
This is where all your original data is stored. Can be any kind of system or intermediate system where your soon-to-analyzed data is stored. From a relational database to a plain text report rendered by any system can be useful as a data source, as long as you have the information you need.
Extract, Transform & Load
Once you have detected your data, location, access, etc., you now need to consolidate this data. For that you need to change the structure of your data, like date formats, identifiers, cross information from different sources, etc. All these are summarized in ETL processes. From the Microsoft technology stack you have SQL Server Integration Services and Visual Studio Shell to create, test and debug this ETL processes. Since Visual Studio is such a powerful tool, you will need a high level technical profile in order to create ETL processes in a reasonable time. These processes usually are executed in background and their frequency determines the freshness of the data to be analyzed.
Data Warehouse
In the previous explanation I mentioned "consolidate", a data warehouse is where you do this. Another way to understand this is that you change the structure or the original data into something that you will easily create reports from. Someone once told me that 80% percent of the issues in BI solutions comes from a poor data warehouse design. So here is not only needed a good database designer but a good understanding of the business need and the information that needs to be analyzed. With Microsoft technologies you have SQL Server to build your data warehouse. Three words you will see very often here are: Facts, Measures and Dimensions. Just search over the internet to find some detailed explanation that is out of the scope of this article.
Multidimensional databases.
After you have all your data consolidated into one single place, you now have to prepare the data to be hammered by reports. In Microsoft technologies you have SQL Server Analysis Services for this. You create, using the Visual Studio Shell (also known as SQL Server Data Tools) multidimensional cubes from relational databases (i.e. data warehouse). You may want to think about multidimensional databases as full indexed tables, but the concepts are way more extended that just this.
Dashboards and reports
There wouldn´t be any analysis without reports, would it be? The final outcome for any BI solution are the reports and dashboards you create. Usually this is the first thing you have to define so you can design all the previous element in a consistent manner. Dashboards are the main reason of a BI solution. The idea of a dashboard is to have a 360 degree of what you want to know about so you can drill down through your reports (i.e. data), understand why and take the corresponding actions to steer your business. When speaking about Microsoft technologies you have SQL Server Reporting Services and in case you haven´t thought about it, Excel is also seen as a reporting tool!
So, this is just a really, really brief explanation of BI, the classic way. But, what about this new experience called self-service BI?
Self-service BI
Reading the pasts paragraphs you may infer that you will need a specialized team to build your BI solution, since there are at least 4 or 5 technologies involved. But the new concept tries to ease your way down to your long awaited dashboards through just one single (or should I say centralized?) tool: Microsoft Excel.
I hesitate to define excel as a single tool because Excel now consolidates a set of tools that are intended to give the end user a centralized experience when building reports or dashboards for data analysis. The tools are:
Power Query
This is a WYSISYG tool that helps you to connect to virtually any data source and transform the data into something you will need for further analysis. Example of data sources are: Oracle, OData feeds, SharePoint Lists, HTML web pages, Azure Marketplace, Facebook, SAP or Salesforce. With Power Query you can have a GUI tool to change the format of the data, split columns, remove rows and any action you may need in order to tune up your raw data.
PowerPivot
When speaking about modelling data, PowerPivot is a handy tool that actually runs sort of a SQL Server Analysis engine in your desktop without any installation needed. Once you have retrieved your data with Power Query, you now can define the relationship between your data, columns name set and tables with friendly names (this concept of "friendly" will be helpful in the future). This new modelled data will be saved along with your Excel Workbook in a compressed format so you can "travel" with this data. Some benefit to store data with PowerPivot is that once you run any pivot table / chart using PowerPivot data, the speed will be notoriously increased when managing medium size data. You can also save as much data as your RAM memory can hold. For this, it is recommended to use the 64bits version of Excel if you intend to you PowerPivot.
Power View
No data is relevant if you can´t see it (at least from a BI perspective). Besides your well known pivot tables and pivot charts, in combination with slicers, time scales, etc. You have now Power View, that enriches the experience of your reports. With Power View you can have richer reports that also features maps, where you can show your data related to a geographical location that can be seen in several ways.
Finally, the previous diagram with the "classic" data stages and tools for BI solutions you now have this equivalent diagram when speaking about Self Service BI:
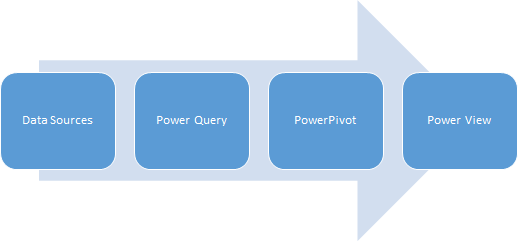
As you can see, now the only thing that lives outside Excel is your data sources!
I hope this explanation gave you some light about the new concepts on our BI experience, in further articles I will try to explain how SharePoint also has something to say about this!